Business charts

Business charts

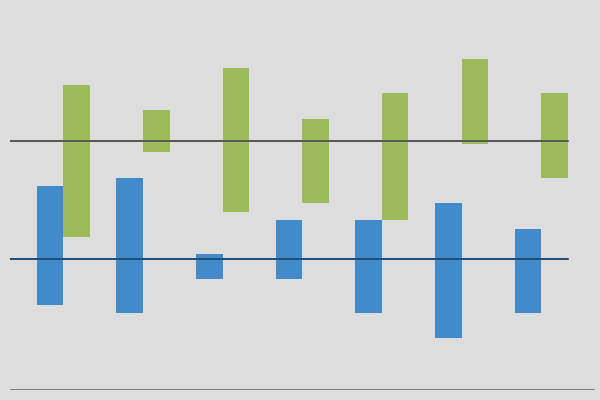
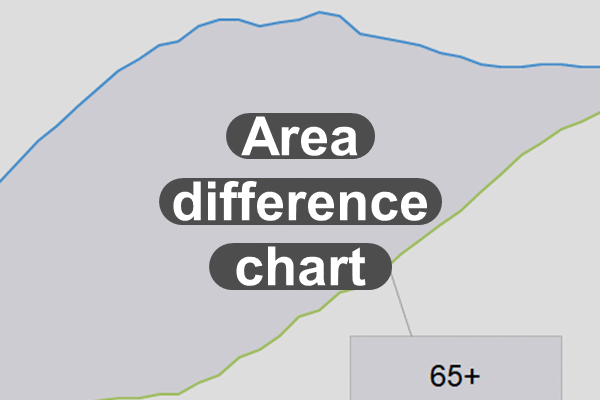
Area difference line chart for Microsoft Excel

The area difference line chart for Excel. Download Overview of the area difference line chart So, this charts shows two lines and the shaded difference between the two. Now, for you chart junkies out there, this is actually a combination chart. First, you have a stacked area chart. Then, there is a line chart. The […]

Clustered column chart for the Excel app

The clustered column chart. Download Overview of the clustered column chart The clustered column chart is perhaps the most widely used chart in business. In general, it has a basic appearance. However, you get an excellent visual of your data in a very simple form. Some like to compare this graph to a pie chart […]

Clustered column chart with scatter chart for Excel

Clustered column chart with scatter chart for Excel The clustered column chart with scatter chart definitely a special combination chart. Requirements Microsoft Excel 2007 or higher or compatible. Download Chart library  Excel Effects home Charts As you may know, charts help you show data and information to your audience in a more visual manner. In […]

Clustered high low chart for Microsoft Excel

Clustered high low chart for Microsoft Excel The clustered high low chart for Microsoft Excel looks like a race to the finish. So, you have high and low comparisons across a series of categories. Requirements Microsoft Excel 2007 or higher or compatible. Download Chart library  Excel Effects home Charts As you may know, charts help […]

Clustered high low chart with average line for Excel

Clustered high low chart with average line for Excel The clustered high low chart with average line for Excel has two average lines. And, both lines stretch across the entire series. Requirements Microsoft Excel 2007 or higher or compatible. Download Chart library  Excel Effects home Charts As you may know, charts help you show data […]

Clustered stacked column and column chart for Excel

Clustered stacked column and column chart for Excel The clustered stacked column and column chart for Excel is a nice looking chart. Basically, you have a stacked column right next to a regular column. Requirements Microsoft Excel 2007 or higher or compatible. Download Chart library  Excel Effects home Charts As you may know, charts help […]

Clustered stacked with two-row category axis

Clustered stacked with two-row category axis The clustered stacked with two-row category axis is kind of a unique chart. First, it has a side-by-side stacked column. Secondly, it has a two-row category axis. Requirements Microsoft Excel 2007 or higher or compatible. Download Chart library  Excel Effects home Charts As you may know, charts help you […]

Clustered stacked-by-stacked column chart for Excel

Clustered stacked-by-stacked column chart for Excel The Clustered stacked-by-stacked column chart for Excel. As you see, we have two series, and separate category titles for each column. Requirements Microsoft Excel 2007 or higher or compatible. Download Chart library  Excel Effects home Charts As you may know, charts help you show data and information to your […]

Column chart on two separate axes for Excel

Column chart on two separate axes for Excel A column chart on two separate axes allows you to scale one side differently from the other. Requirements Microsoft Excel 2007 or higher or compatible. Download Chart library  Excel Effects home Charts As you may know, charts help you show data and information to your audience in […]

Column chart with average line for Excel

Column chart with average line for Excel The column chart with average line is a very common chart in many companies. It is a combination chart, just with an average line, going straight across the series. Requirements Microsoft Excel 2007 or higher or compatible. Download Chart library  Excel Effects home Charts As you may know, […]


Business charts