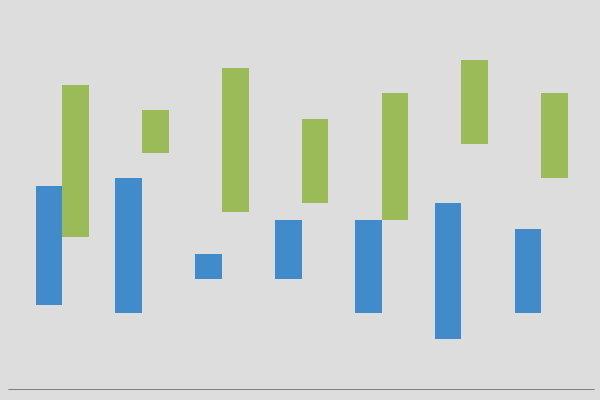
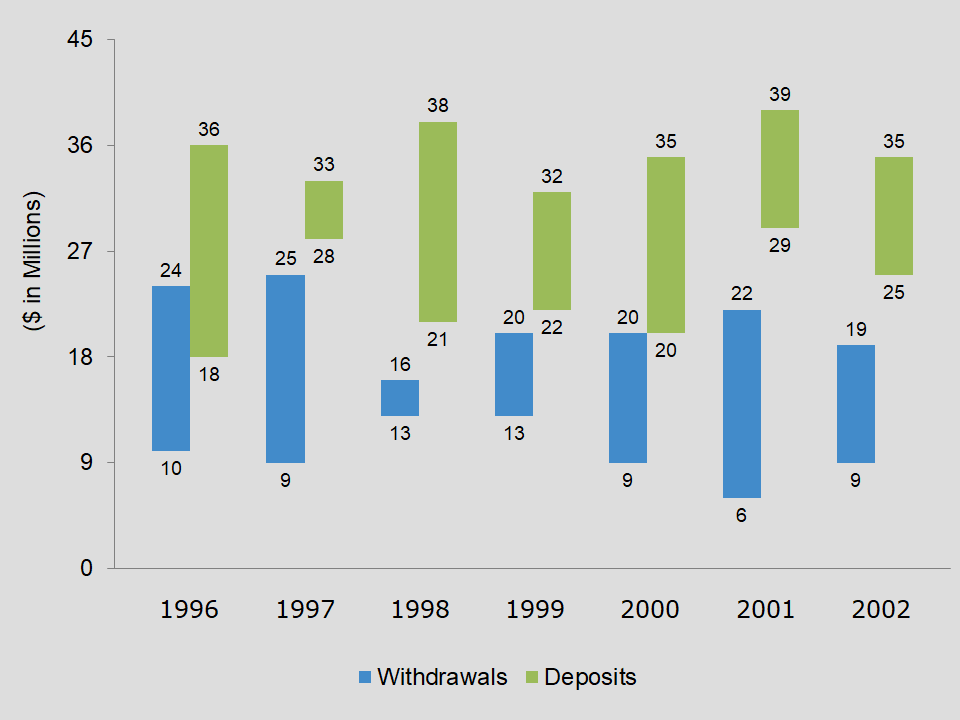
Clustered high low chart for Microsoft Excel
The clustered high low chart for Microsoft Excel looks like a race to the finish. So, you have high and low comparisons across a series of categories.
Requirements
Microsoft Excel 2007 or higher or compatible.