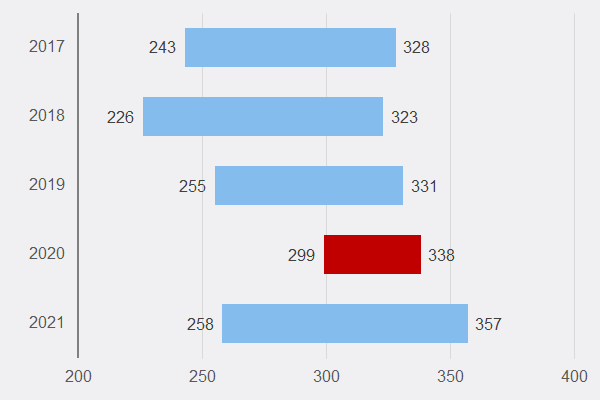
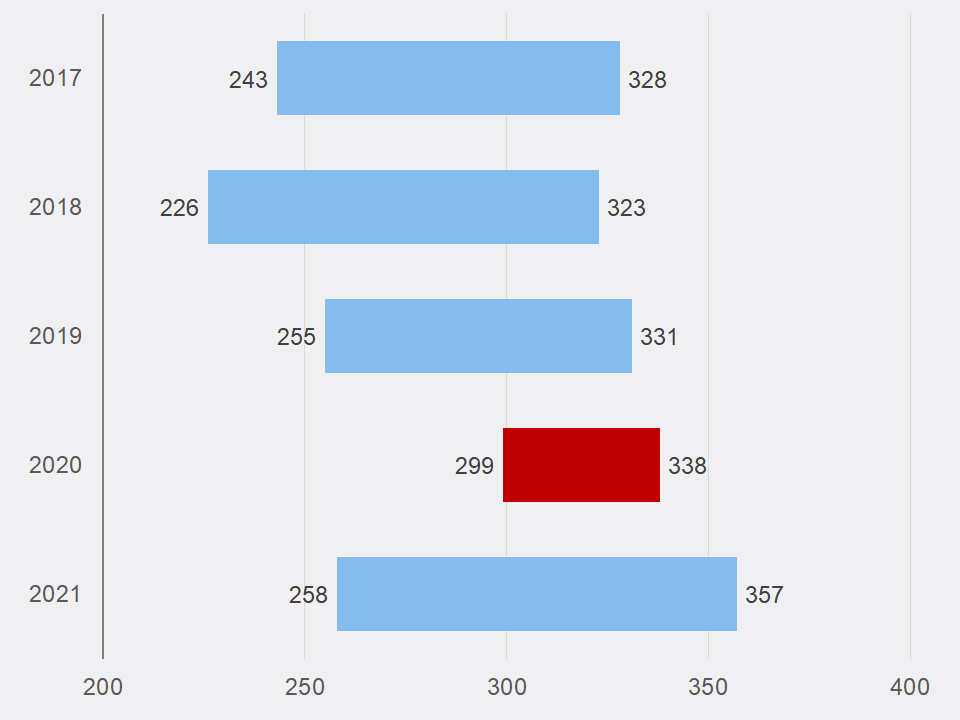
Bar high low chart overview
On the whole, the bar high low chart is a great way to show the difference between two values. In addition, this chart also helps analyze the progress of an event or activity. This chart is commonly used in businesses. However, it works for just about anyone looking for a nice way to view a range between values.
Now, the only thing is, how do you determine if the range went up, or went down. For example say if you enter 10 for the low value, and 20 for the high value. Well, did you start at 10 and go to 20, which is probably good. Or, did you start at 20 and go to 10, which is probably not good.
So, what you would want to do is, maybe have a color for positive change, and a color for negative change.
We did not include that functionality in this chart. But, you can manually change the color yourself, to reflect positive and negative change.
Requirements
Microsoft Excel 2007 or higher or compatible.