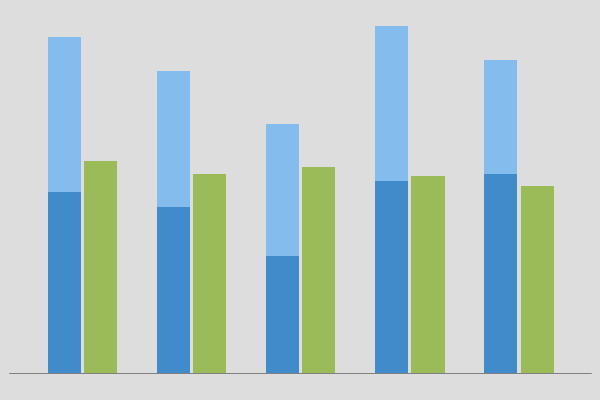
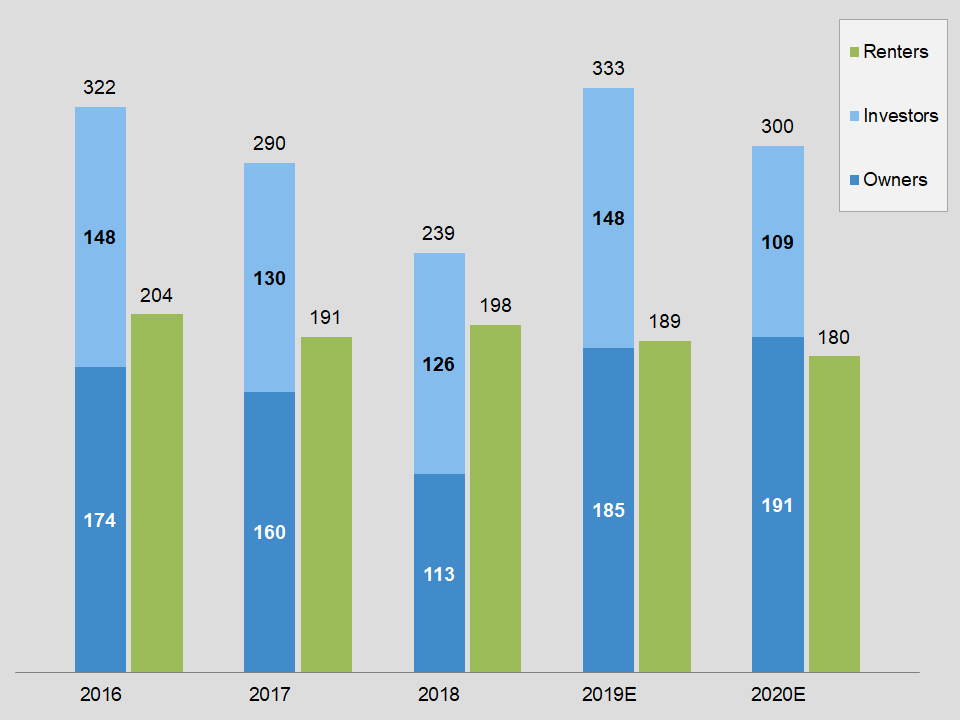
Clustered stacked column and column chart for Excel
The clustered stacked column and column chart for Excel is a nice looking chart. Basically, you have a stacked column right next to a regular column.
Requirements
Microsoft Excel 2007 or higher or compatible.