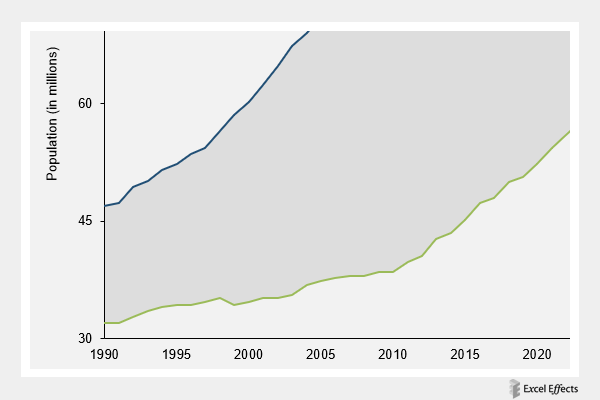
Area difference chart in Excel
The area difference chart is kind of unique. Essentially, this version combines a line and stacked area chart.
Learn moreCharts
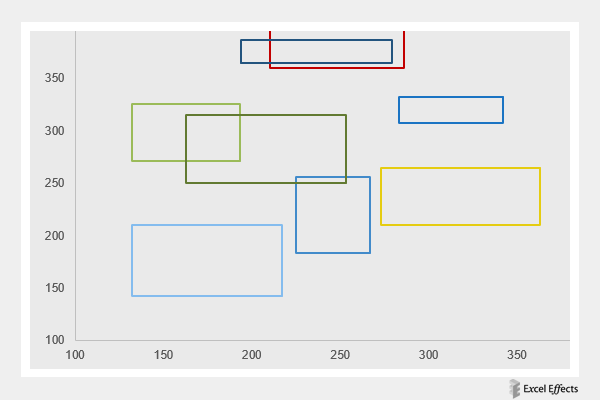
Box chart
We must say, the box chart is truly a unique data tool. If you are building a graph natively, then you will not find this type in your options.
Learn moreCharts
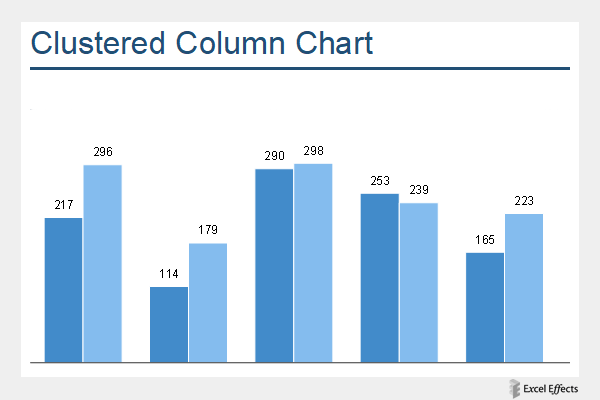
Clustered column chart
The clustered column chart is very similar to the standard column. Instead, it has additional columns, side-by-side, forming a cluster.
Learn moreCharts
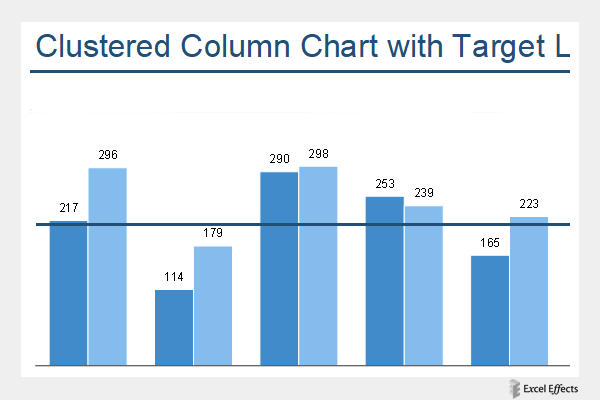
Clustered column chart with target line
The clustered column chart with target line allows you to compare multiple series to a particular goal.
Learn moreCharts
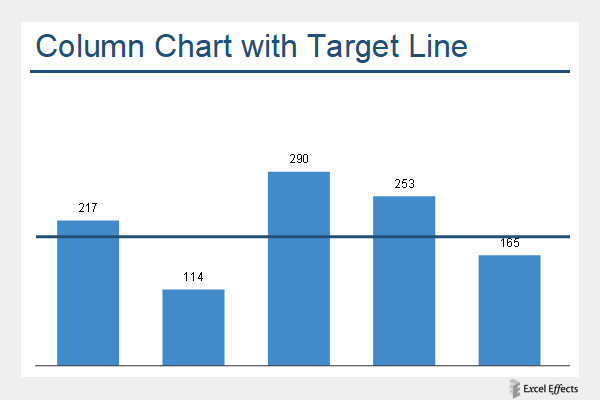
Column chart with target line
The column chart with target line is great for viewing which items meet, exceed, or fall below a particular goal.
Learn moreCharts
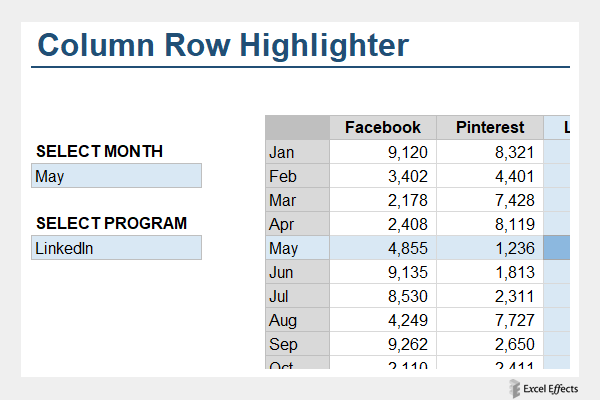
Column row highlighter
The column row highlighter is a spreadsheet tool that automatically highlights a row and column based on user selections.
Learn moreSpreadsheet tools
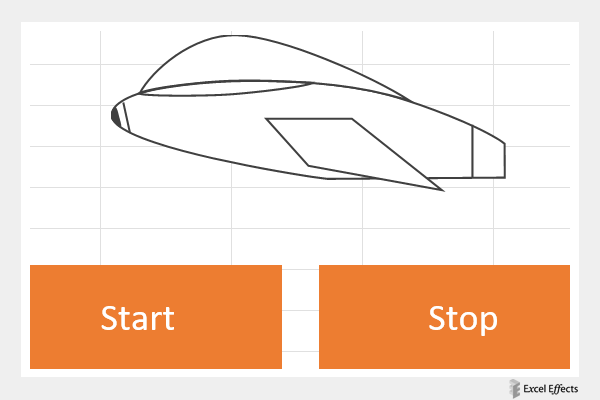
Flying spaceship in Excel
So, we have a flying spaceship animation program that we did in Excel. We now know full-fledged games are highly possible in Excel.
Learn moreGames
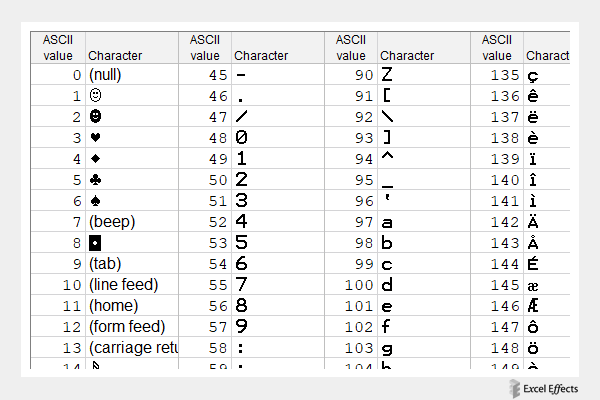
Original ASCII character table in Excel
Firstly, we learned about the original ASCII table in middle school. Yeap, that young.
Learn moreSpreadsheet tools
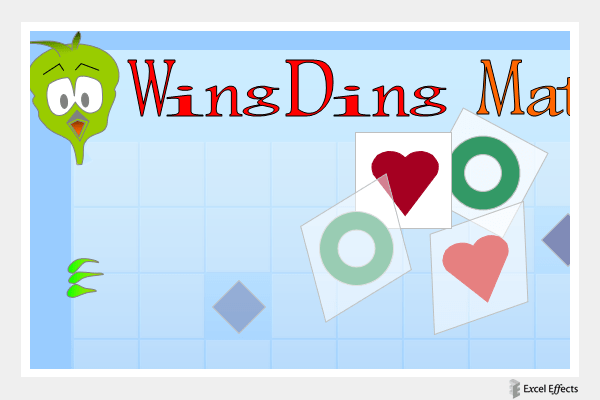
Original Wingding Match game for Excel
Before our other matching games, there was the original Wingding Match game. Unlike the others, there are no tricks to it. Just a straight matching game.
Learn moreGames
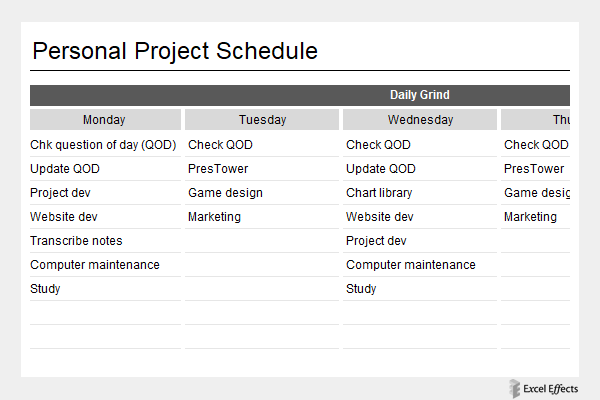
Personal Project Schedule for Excel
The Personal Project Schedule for Excel is a private project management tool that helps you organize your tasks.
Learn moreSpreadsheet tools
Random ones and zeros
Random ones and zeros is just what you need to create a matrix. In other words, a unique background, similar to the images you see on the web.
Learn moreSpreadsheet tools
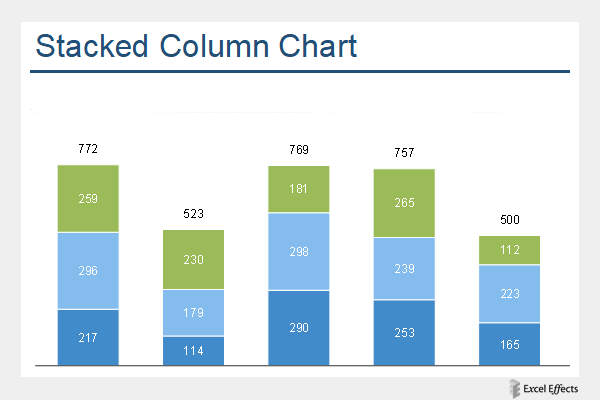
Stacked column chart
The stacked column chart allows you to compare items as part of a whole. In this tool that we have for you, there are three parts.
Learn moreCharts