Chart library
Our chart library has so many tools to download. We have business, math, and special charts to satisfy any project.
Charting menu
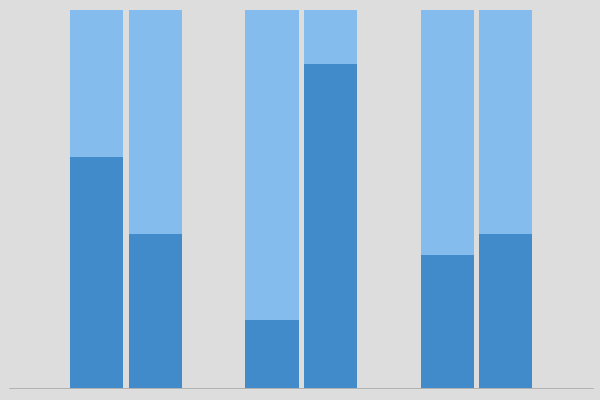
Clustered stacked-by-stacked column chart for Excel The Clustered stacked-by-stacked column chart for Excel. As you see, we have two series, and separate category titles for each column. Requirements Microsoft Excel 2007 or higher or compatible. Download Chart library
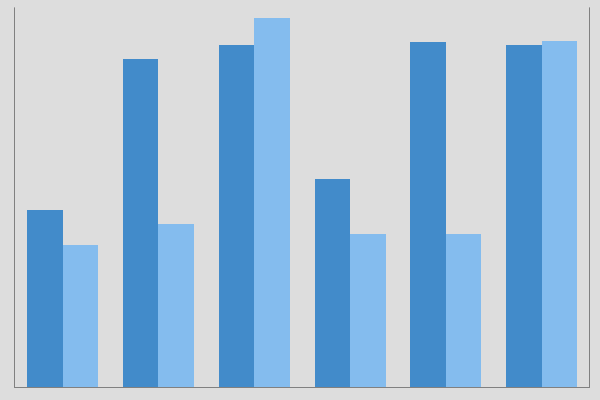
Column chart on two separate axes for Excel A column chart on two separate axes allows you to scale one side differently from the other. Requirements Microsoft Excel 2007 or higher or compatible. Download Chart library
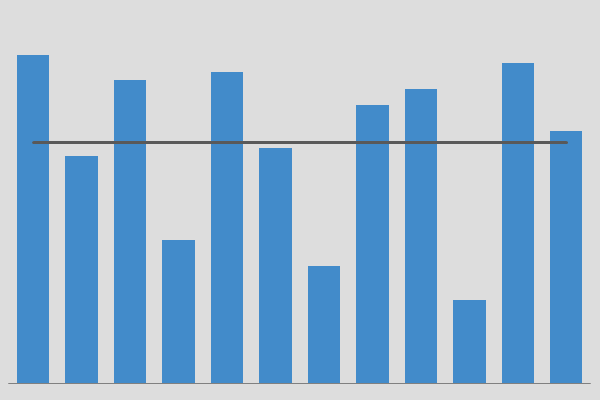
Column chart with average line for Excel The column chart with average line is a very common chart in many companies. It is a combination chart, just with an average line, going straight across the series. Requirements Microsoft Excel 2007 or higher or compatible. Download Chart library
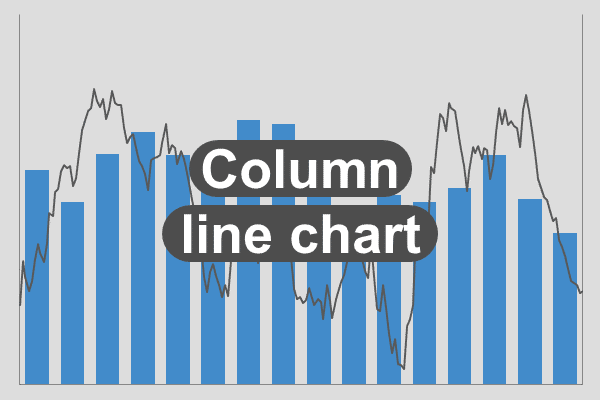
Column chart with scatter line chart for Excel The column chart with scatter line chart for Excel is also known as a combination chart. Requirements Microsoft Excel 2007 or higher or compatible. Download Related Chart library
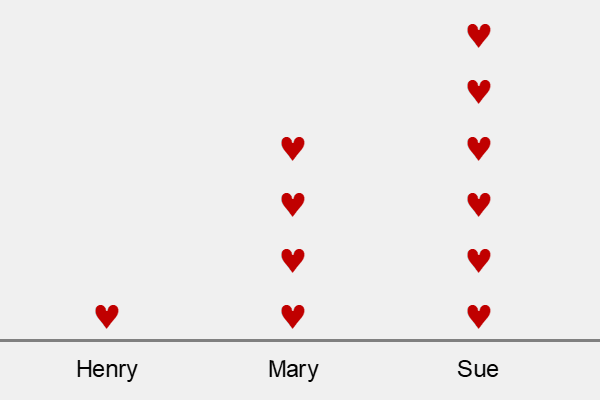
Hearts column sheet chart The hearts column sheet chart is a graph that is designed on a worksheet in Excel. Although it is somewhat unique, it is not uncommon. So, just imagine all the stuff you can do with sheet charts. Good stuff! Keep in mind, we include a movable chart within the sheet. This […]
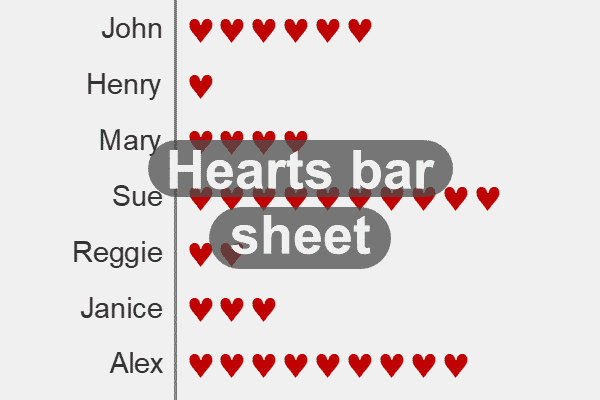
Hearts row sheet chart The hearts row sheet chart is a graph that is designed on a worksheet in Excel. Although it is somewhat unique, it is not uncommon. So, just imagine all the stuff you can do with sheet charts. Good stuff! Keep in mind, we include a movable chart within the sheet. This […]
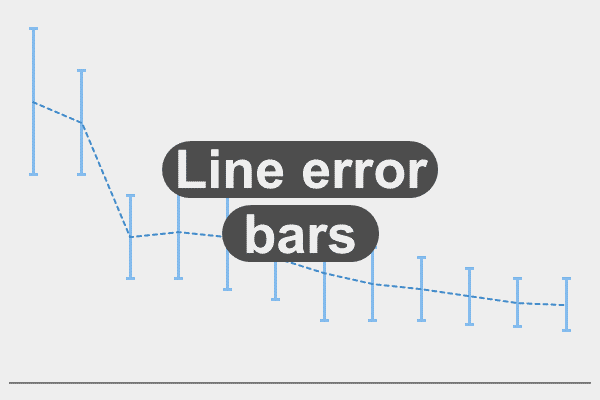
Line chart with high low bars for Excel Sometimes, you may see a line chart like this on TV, on business channels. Now, the high-low bars may look different. But, it is the same concept. Requirements Microsoft Excel 2007 or higher or compatible Download Chart library
The Marimekko – one level chart Believe it or not, the Marimekko – one level chart, is actually an area chart in Excel. Now, isn’t that something? It is a unique chart. And, in the beginning, it took a while learning how to create it. But now, we have one where you can just plug […]
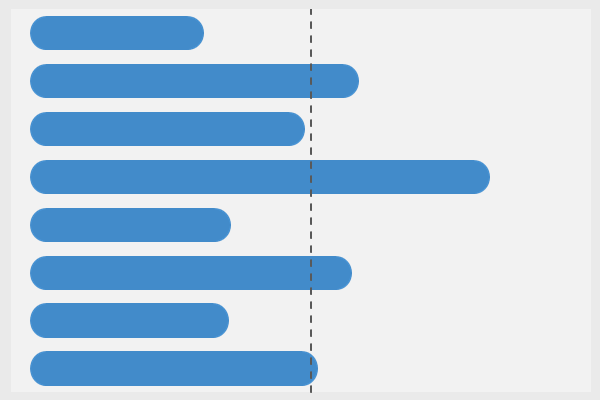
Pill Bar overview The pill bar with average line chart is similar to a regular bar chart. Instead, with this chart, the two endpoints are round. Thus, you get what looks like a pill. Of course, as with the bar chart, this chart is shows everything in a horizontal manner. Now, with all that said, […]
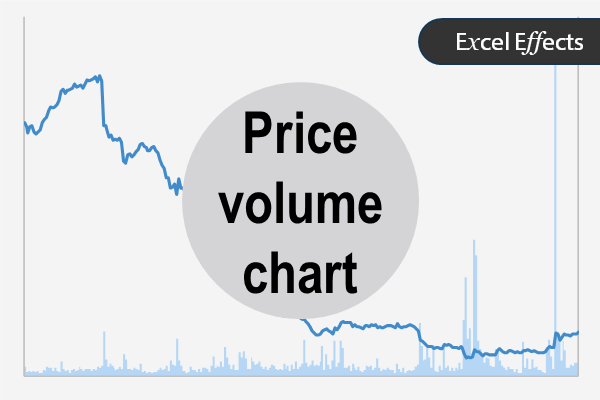
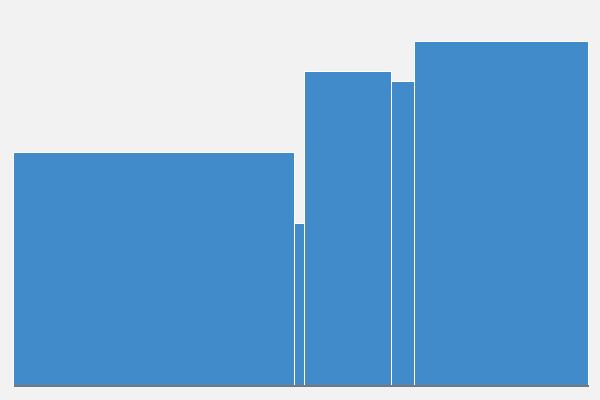
Overview of price volume charts Price volume charts show the relation of shares traded to its price. For the most part, you see this chart in financial institutions, particularly investment banks and the stock market. Excel is the primary app to create this chart type. However, creating it is not necessarily easy. Therefore, feel free […]
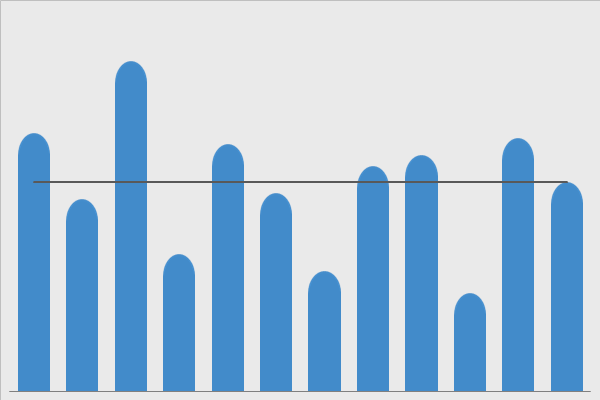
The rounded column chart with average line is very similar to our column with average line chart. Basically, it shows data across categories. In addition, the average line shows the central tendency of the values. Moreover, you can visually view which categories are above or below average. Adjusting the Rounded Top Now, depending on the […]
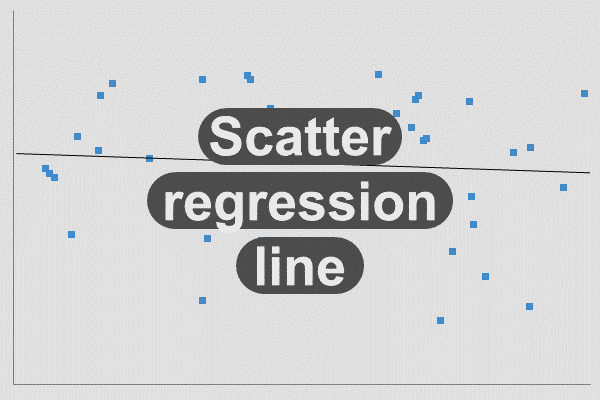
Scatter dots chart with trendline for Excel. Download Overview of scatter dots chart with trendline The scatter dots chart allows you to display data using x, y coordinates. It is a great way to show the spread of many data points. In addition, we include a trendline with the formula to help you see if […]