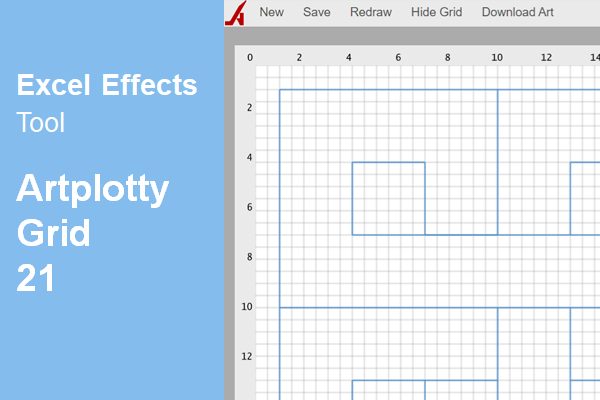
In all, Artplotty Grid 21 or AP Grid 21 is a drawing tool that uses numbers to create art. In fact, it is an excellent tool for professionals, students, teachers, and hobbyists.
Note: We are in the process of updating all the images on this page. Thank you for your patience.
Features of Artplotty Grid 21
- Nice 600 by 600 pixel art board
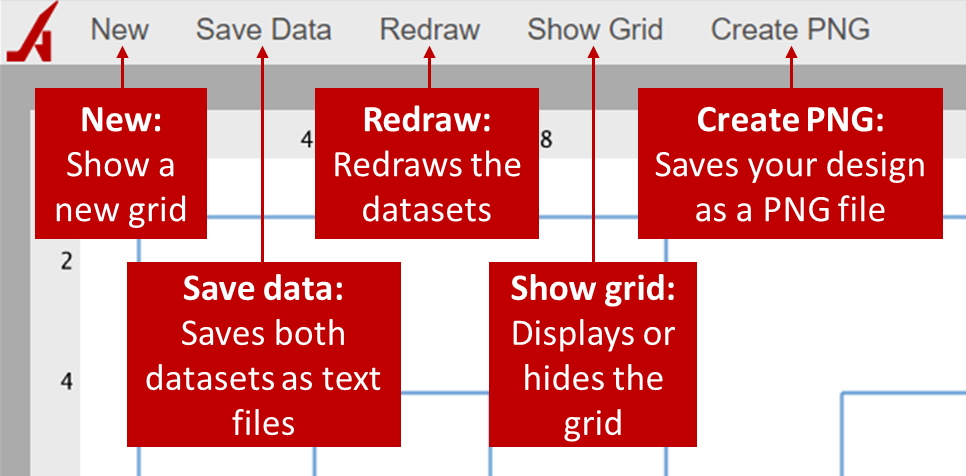
- Redraw option to display changes and corrections
- Download option to save art as an image
- Show art with or without the grid
- Multiple data sets for different types of shapes
- Enter key coordinates as whole numbers or as decimal numbers
Requirements
To use AP Grid, you need a browser and access to the Internet.
The following browsers support AP Grid:
- Chrome
- Firefox
- Internet Explorer 9 (IE) or higher
- Microsoft Edge
- Opera
- Safari
- Waterfox
Note: The Create PNG option does not work in IE, Microsoft Edge, or Safari. Works best in Google Chrome.
Overview of Artplotty Grid 21
Coupled with a drawing grid and data sets, all you need to make AP Grid work are numbers. Overall, it is a great tool that combines art, math, and engineering. Now, that is STEAM!
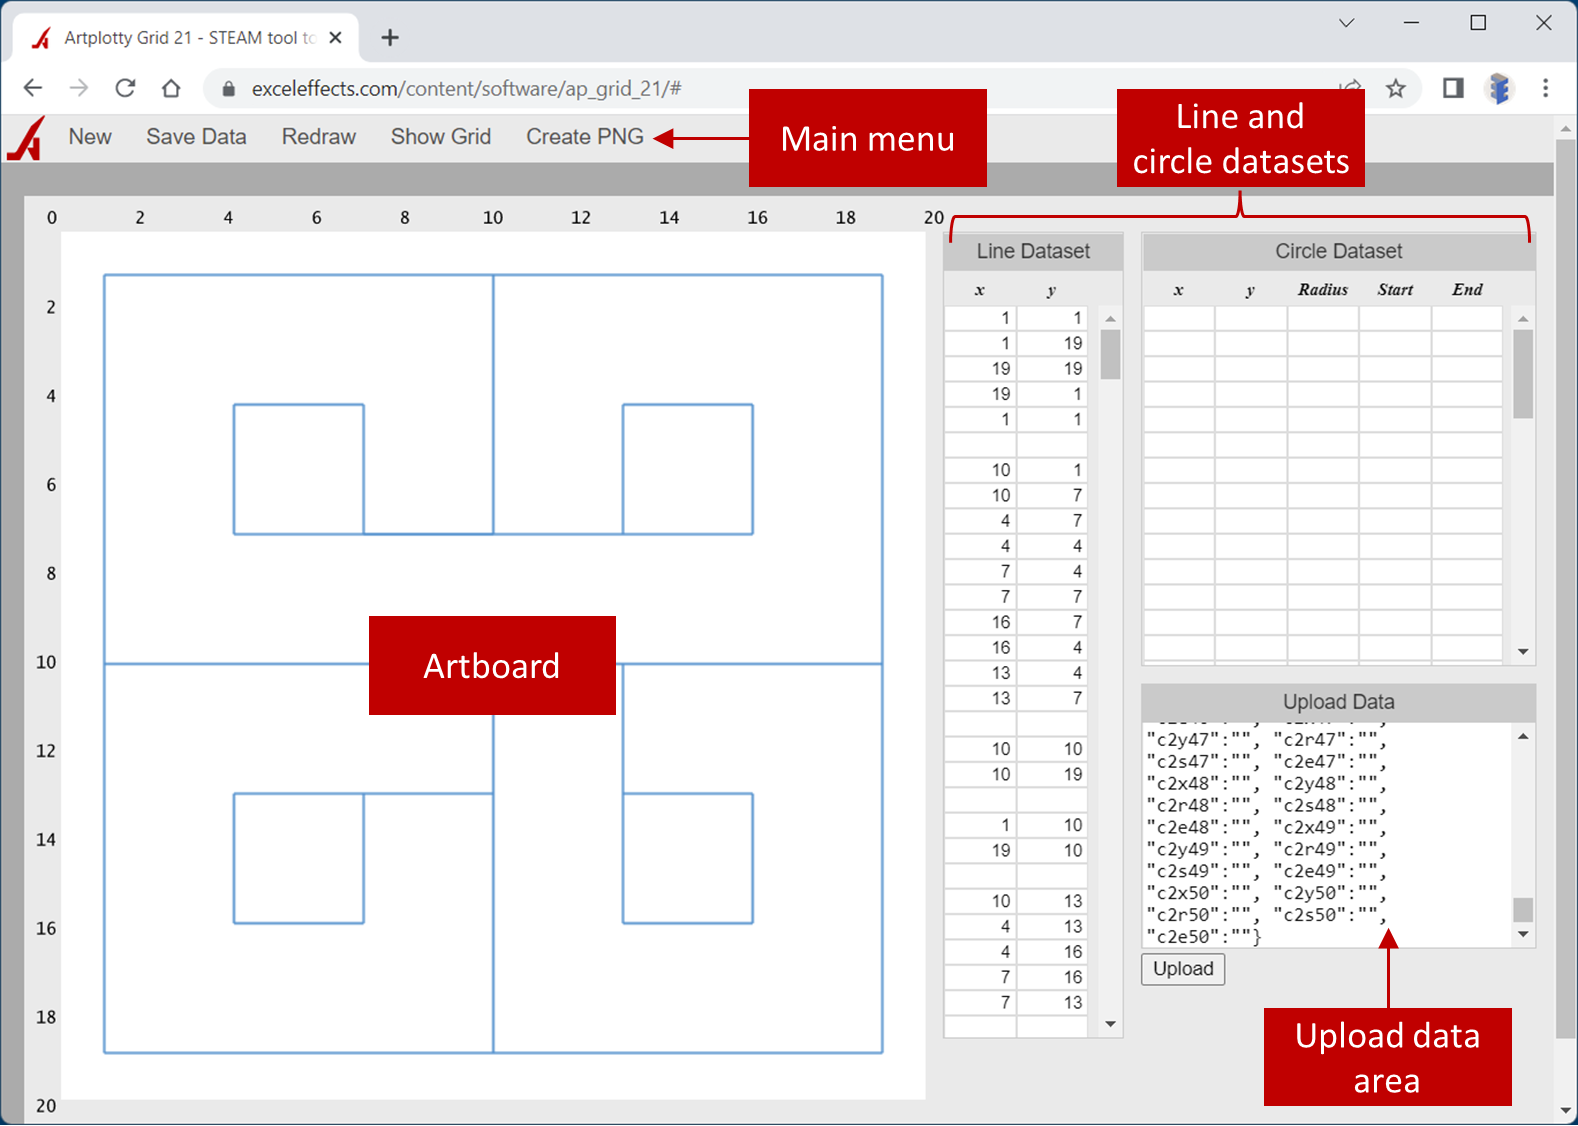
Main Menu
The Artplotty Grid art board
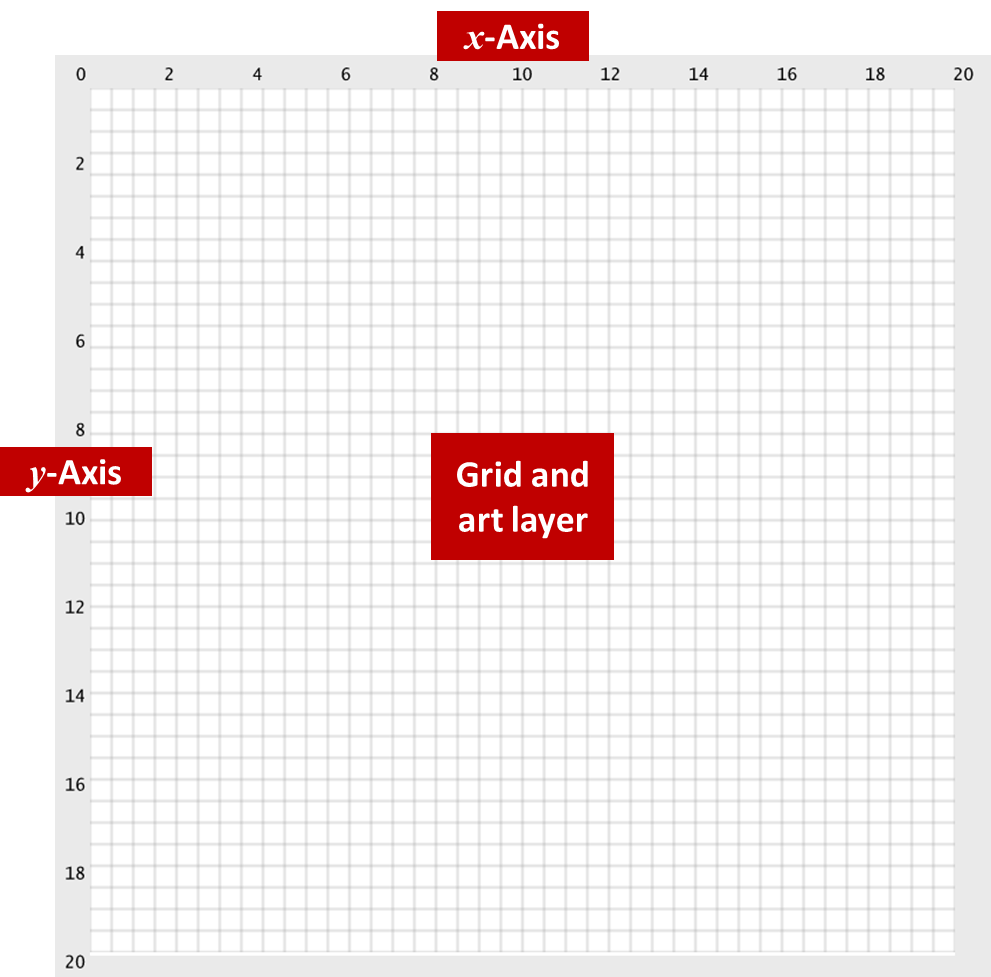
Within the art board, is the grid, x-axis, and y-axis. For the size of the grid itself, it spans 600 pixels in both directions.
The Data Sets
Using the line and circle datasets, you can cover a large amount of the grid. The main reason behind that is, you get to use decimal numbers for your key values.
Thus, you can have a values like 2.111 and 19.999. Just keep in mind that, the minimum value for both x and y is 0. And, their max value is 20. Although the grid is 600 pixels in size in both directions, we use small numbers to make it easier to plot points.
Using Artplotty Grid
Creating Lines
To create a line, you need two or more points. Altogether, the line data set holds up to 400 points.
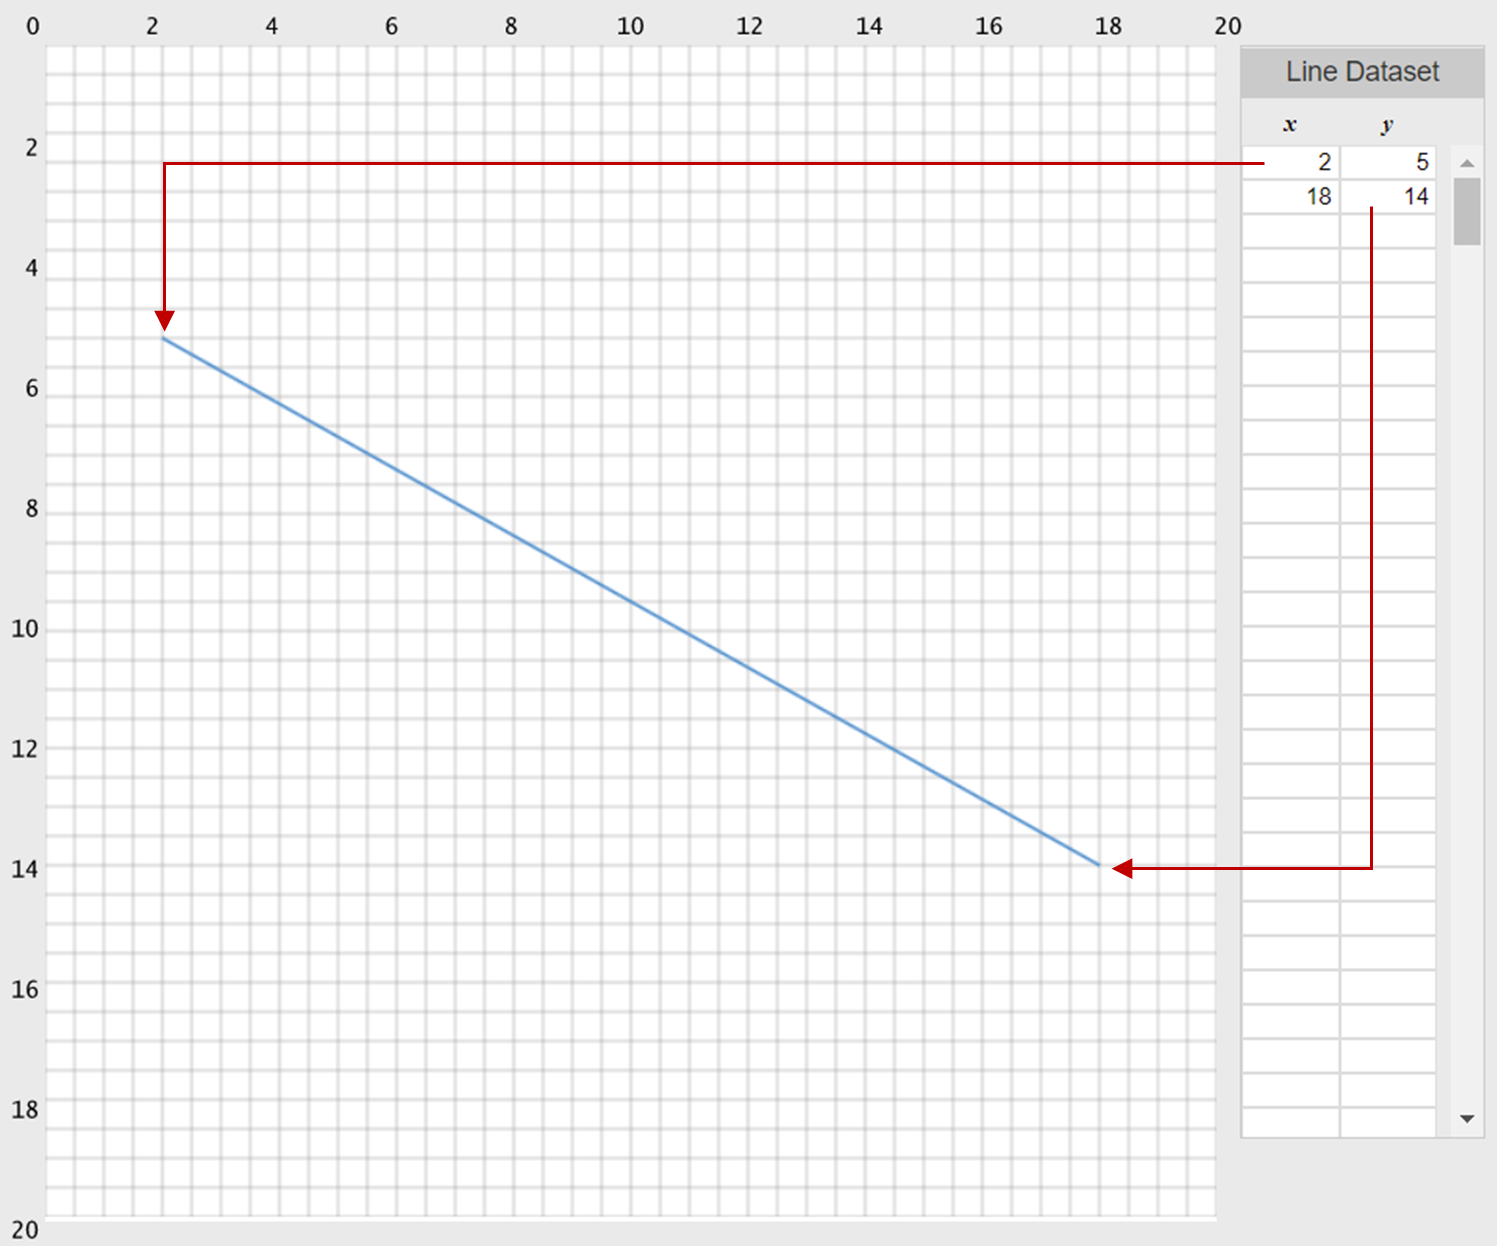
With that in mind, follow the steps below to create a line from point (2, 5) to point (18, 14).
- Firstly, click New from the menu
- Under the line data set, type 2 for x and 5 for y
- After that, right under (2, 5), type 18 for x and 14 for y
There you have it! A line from (2, 5) to (18, 14).
Note: You can also input decimal numbers, such as 2.403 and 9.999 also works.
Continuing the Line
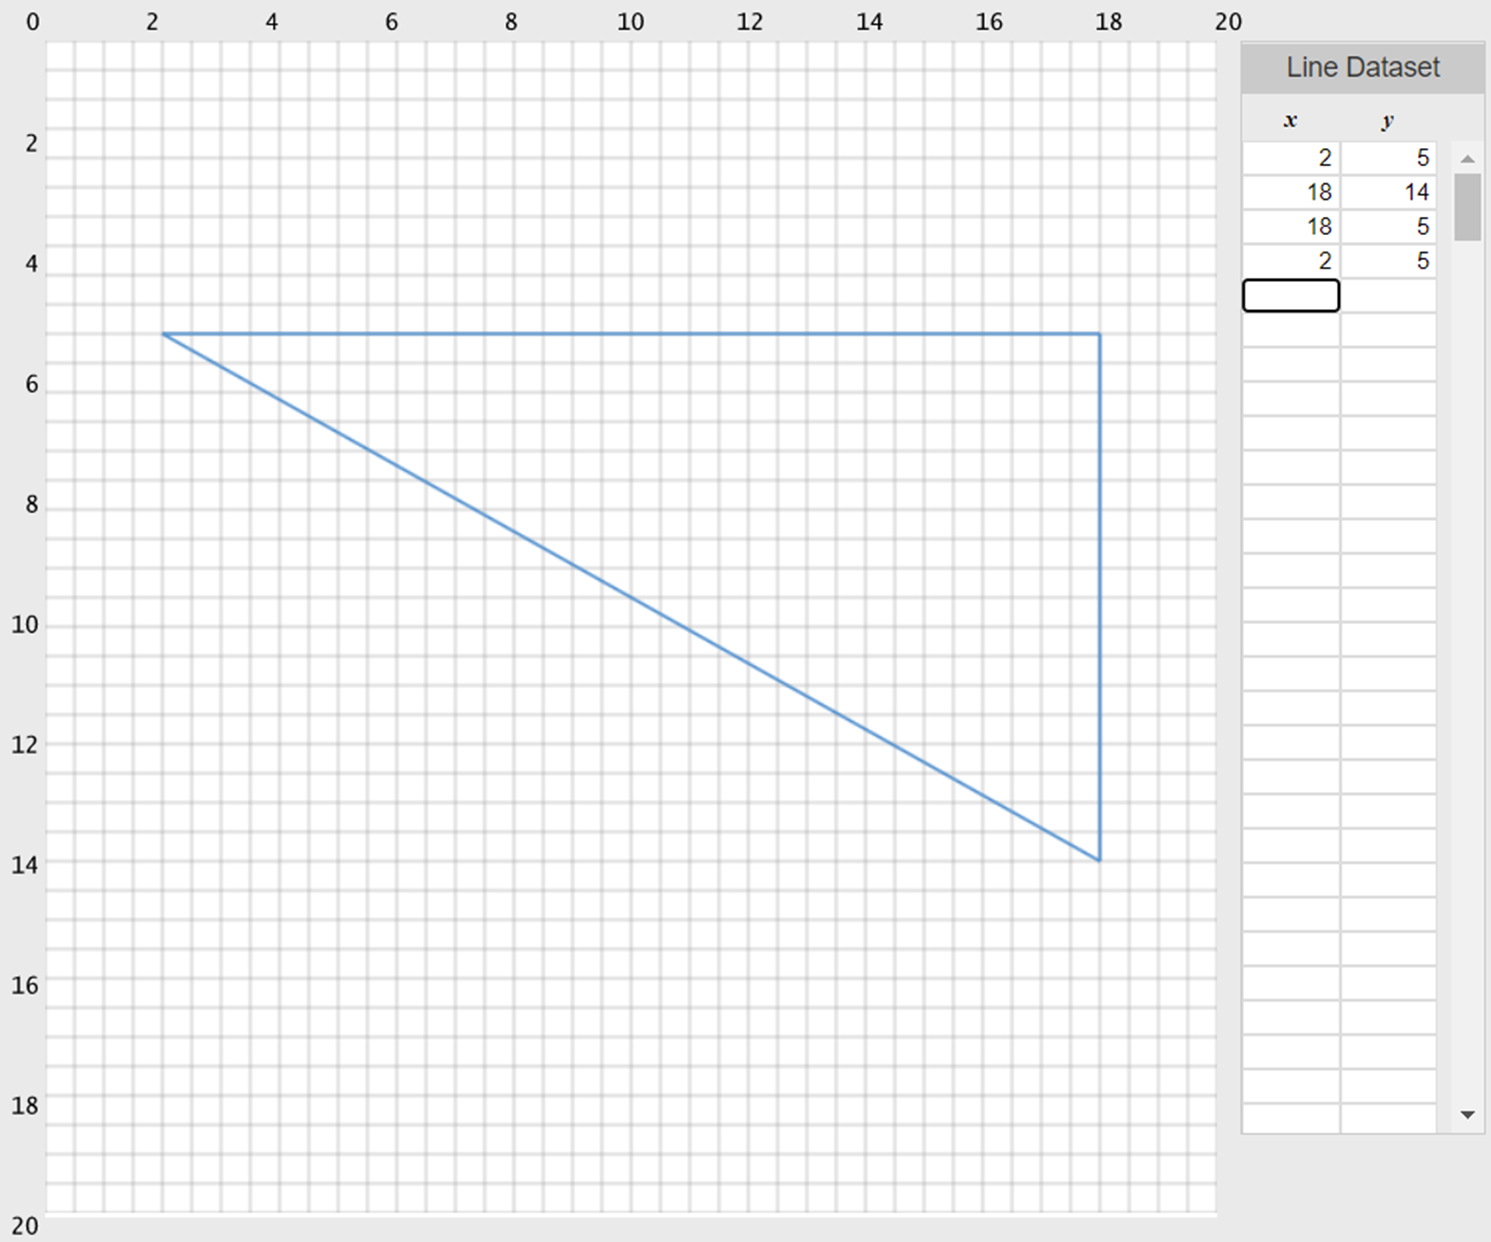
If you want, you can continue from the previous point to a new point, which will keep the line going. In the above example, we add two more points, forming a triangle.
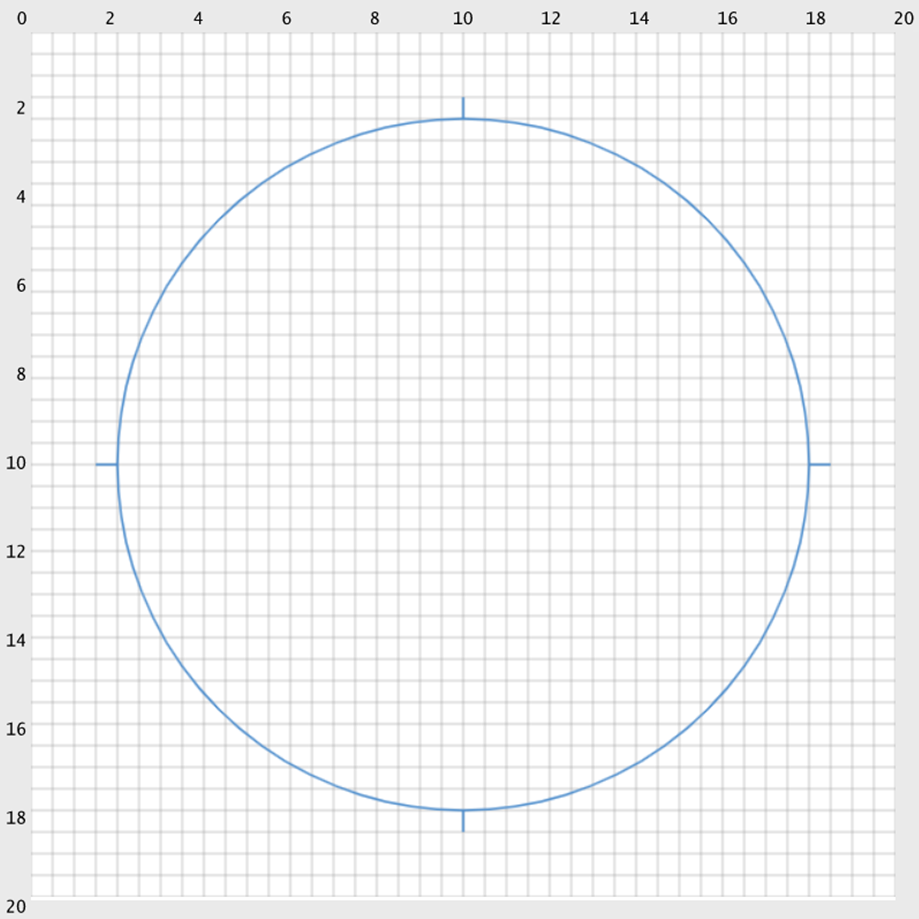
Creating Circles
Likewise, creating a circle requires data. Therefore, the main data you need is the circle’s center point (x, y) and its radius (r). Of course, we have those options ready for you within the circle data set.
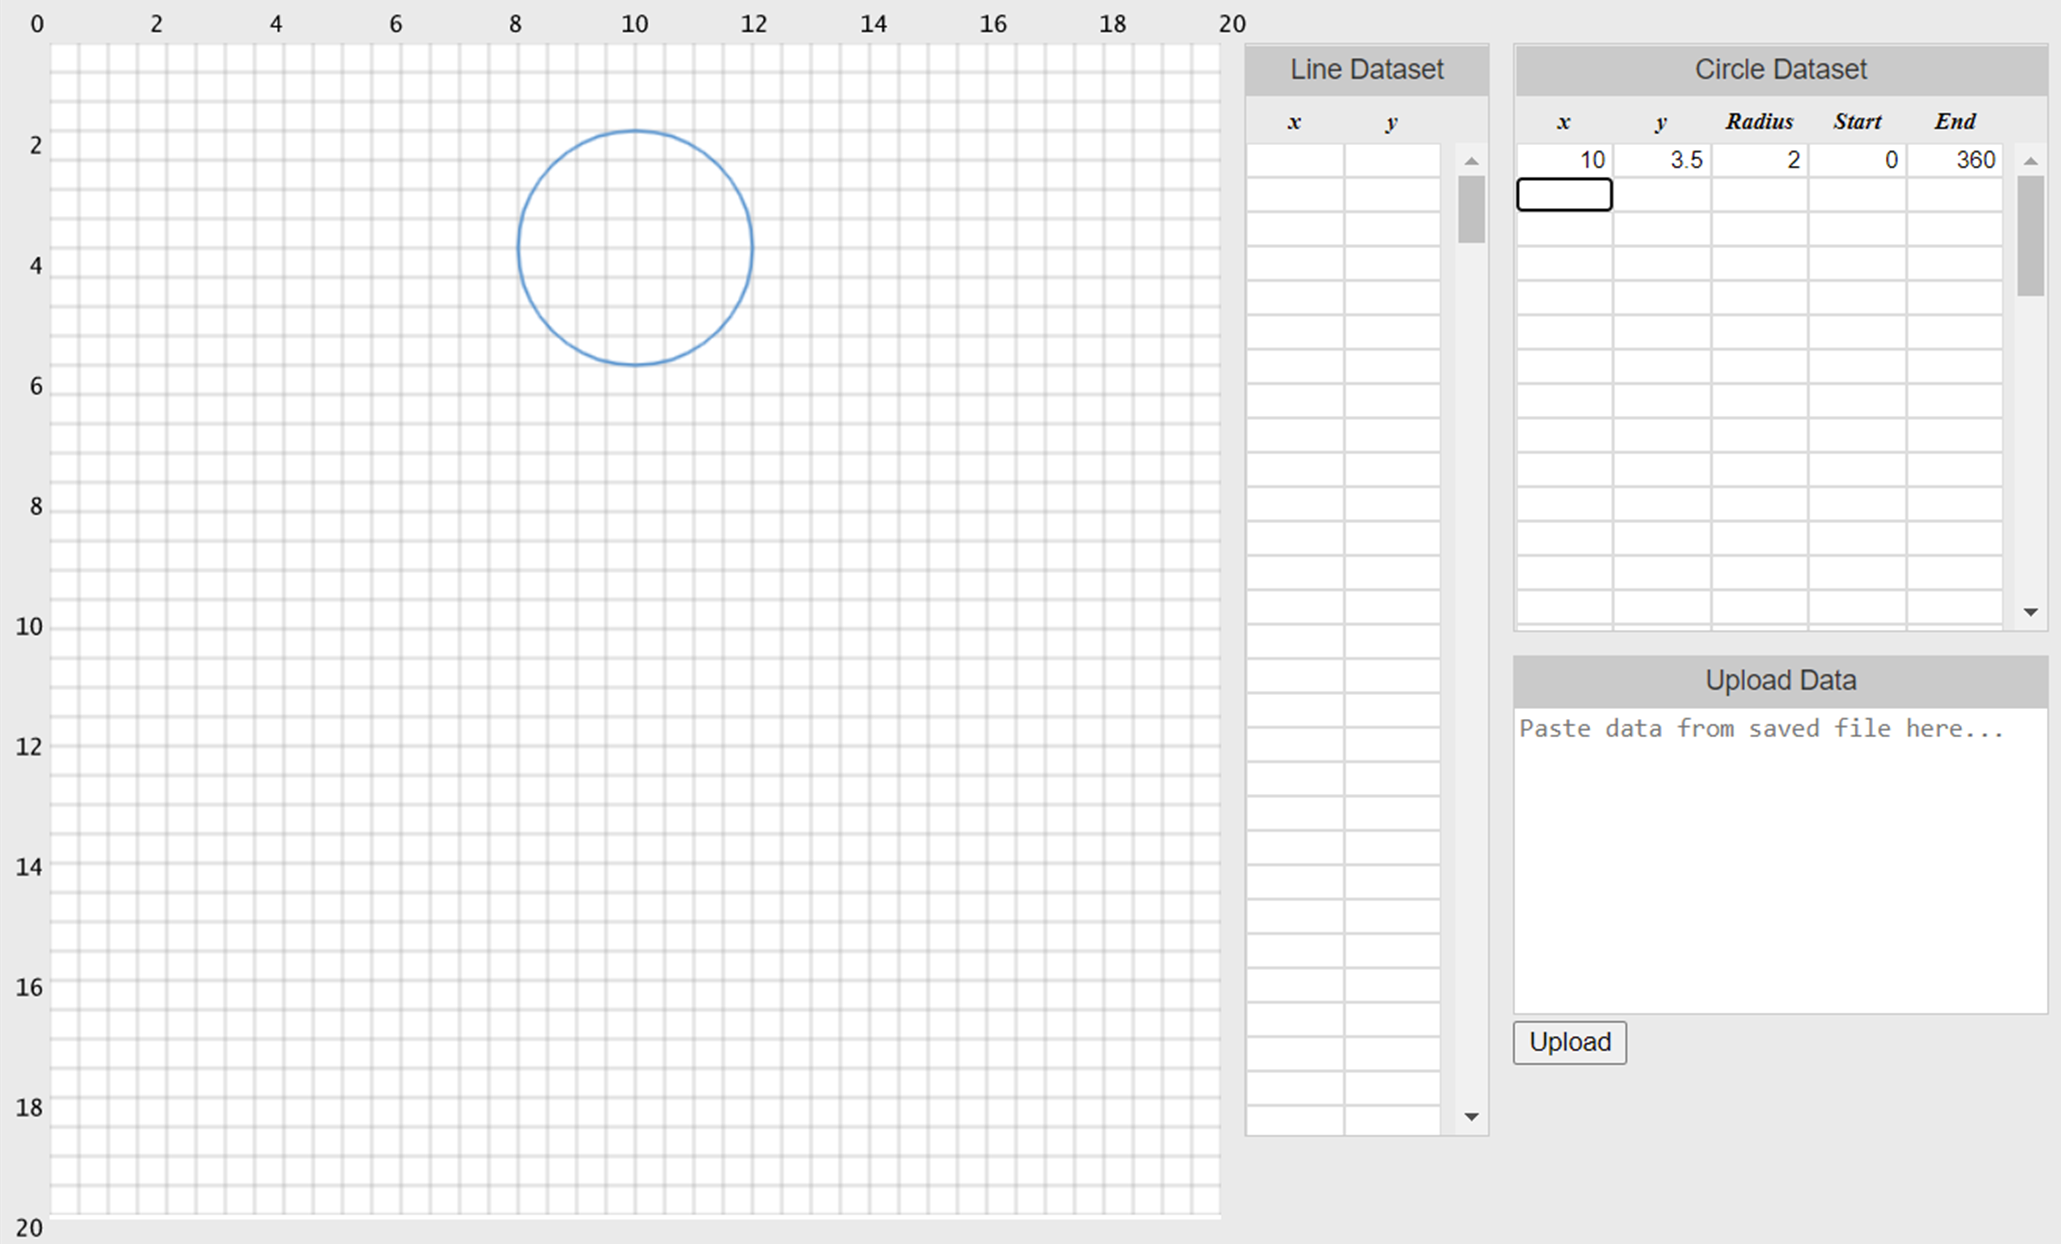
So, let’s create a circle at center point (10, 3.5), with a radius of 2.
- Click New from the main menu
- Under the circle data set, type 10 for x and 3.5 for y
- For the radius, type 2 for r
As you see, you need all three values to make a circle. Moreover, you can also enter decimals, like 19.999 and 5.374 for x, y, and r.
In case you did not see, the Start and End values are automatically populated, with 0 and 360. You can change these if you understand angles. For now, just understand, a full circle generally starts at 0 and ends at 360.
The Redraw Option
Occasionally, you may need to make a change or correction to your data. In that case, you will need to redraw your points. Click Redraw from the menu to update your art.
Note: Reloading the page will also update your artwork.
Create PNG – downloading your artwork as a PNG
At the moment, the Create PNG option only works on certain browsers. For instance, you can download your art without a problem in Google Chrome and Mozilla FireFox. On the other hand, that option does not work in Internet Explorer nor Safari.
Note: If you have issues saving as a PNG, then consider hard refreshing the browser, by pressing Ctrl F5. You may want to save your work first.
Saving your work
To save your work, simply click on the Save Data option, from the main menu. When you click on Save Data, the datasets will be saved in a text file.
Note: The gridlines will not be saved with the design.
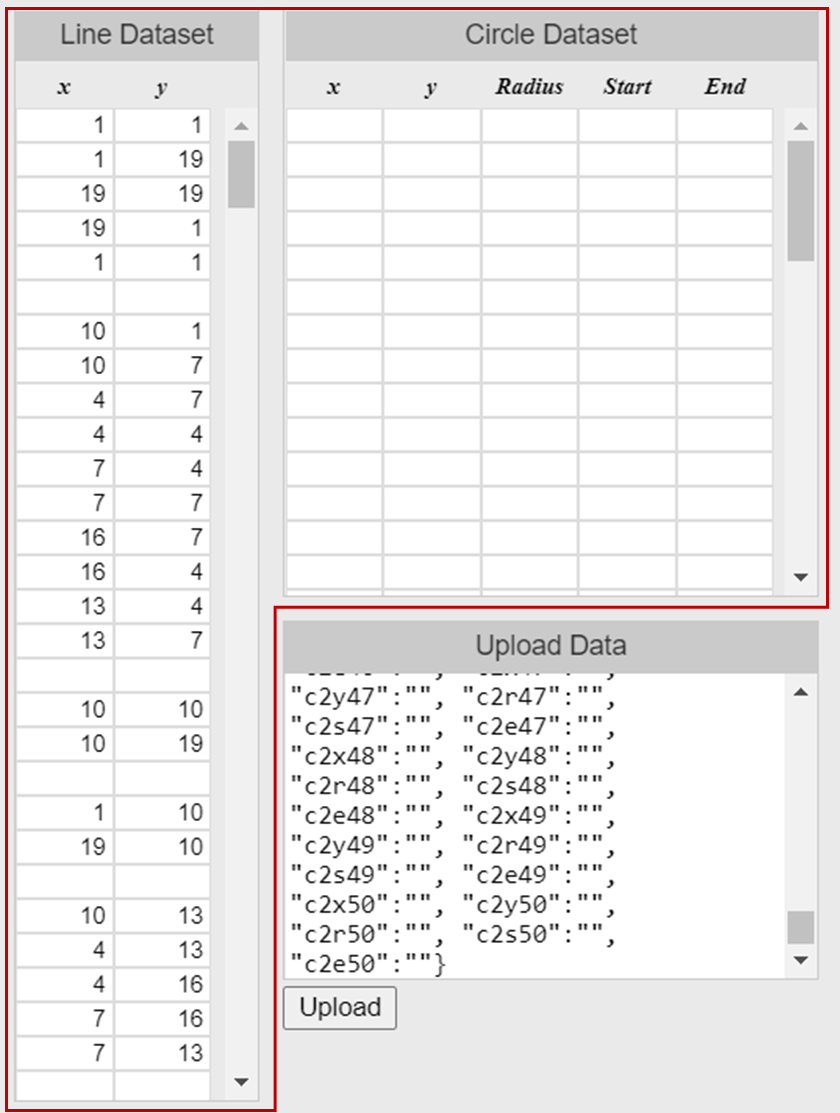
Uploading data to Artplotty Grid 21
If you save your data using the Save Data option, then you will be able to upload it in Artplotty. Simply open the text file, copy the contents, and paste it in the Upload Data box. Then, click Upload. Afterwards, your design will show on the grid.
Creating Arcs
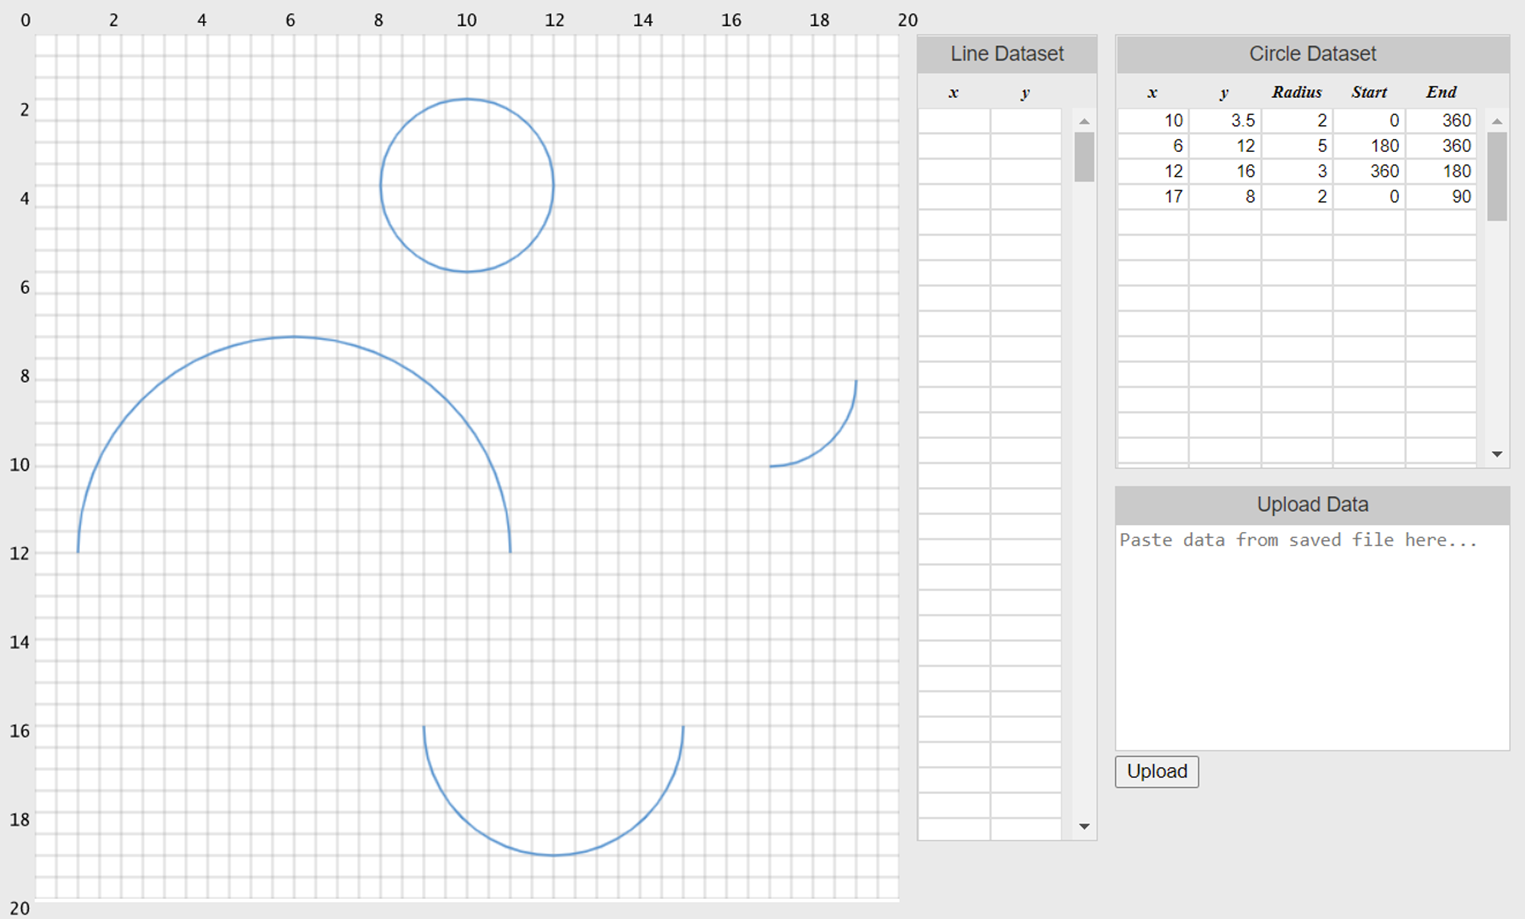
Arcs are angles that do not go all the way around. Basically, you create an arc by specifying a start point and an end point. In AP Grid, the starting and ending points are in degrees. Typically, a full circle goes from 0 degrees to 360 degrees. That is one rotation, which is all you need. However, you can input degrees beyond 360.
How It Works
All you need to do is, input the start and end angle. In addition, you have to be mindful of the fact that the angles go in a clockwise direction.
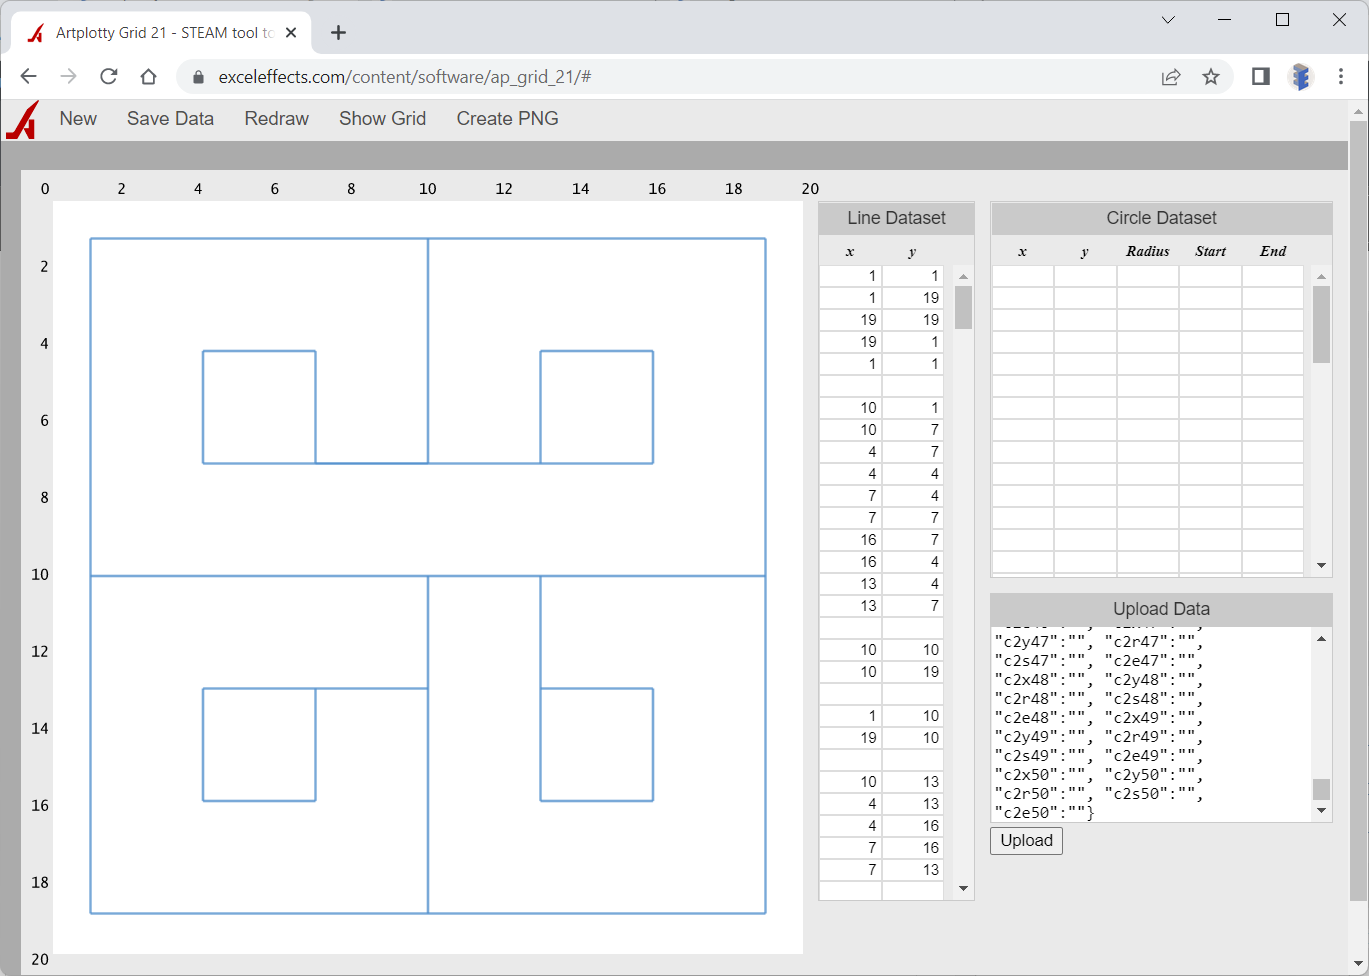
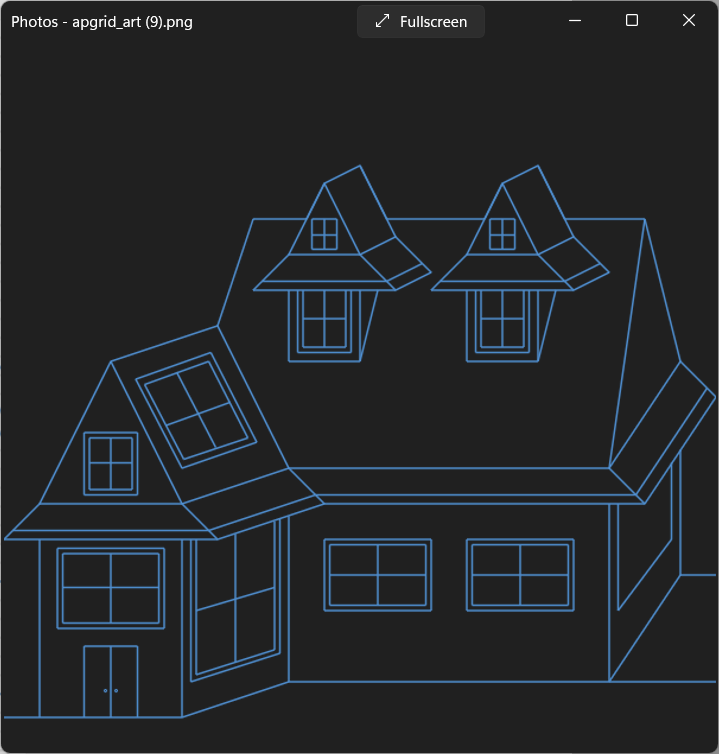
Sample designs
Below are some sample designs from Artplotty Grid 21 online.