
Scatter dots chart with trendline for Excel.
Overview of scatter dots chart with trendline
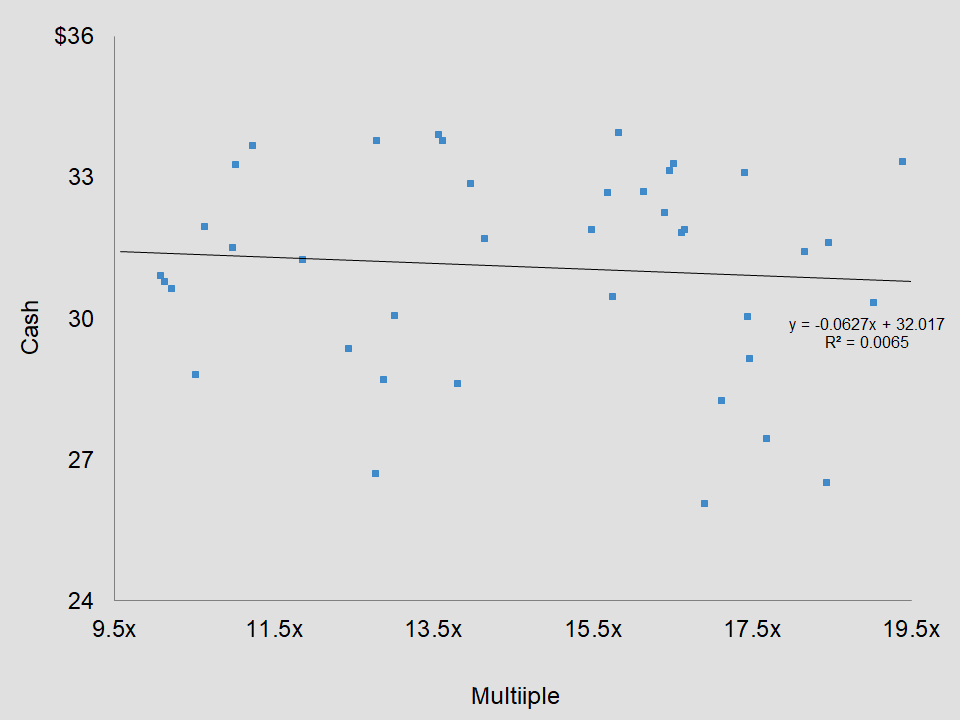
The scatter dots chart allows you to display data using x, y coordinates. It is a great way to show the spread of many data points. In addition, we include a trendline with the formula to help you see if there are any patterns in the data.
Requirements and download
This particular chart requires Excel 2007 or higher or compatible.
Click on the button below to download this chart.
Chart library Excel Effects home
General overview of charts
As you may know, charts help you show data and information to your audience in a more visual manner. In addition, it tends to keep the attention of your client. So, you can also learn how to create a chart from scratch. This way, you will have a better understanding of the process for creating a chart.
There are various apps that allow you to create charts. Of course, Microsoft Excel (or Excel) is a very popular app for working with charts. However, you can use Google Sheets, Apache OpenOffice, or LibreOffice to create charts. For the most part, they are compatible with Excel.
Overview of Excel
Excel is a spreadsheet app. On the whole, it features tools to help you perform calculations. Moreover, it has graphing tools and a programming language called Visual Basic for Applications (or VBA). VBA allows you to do many things, like automating data functions. Also, Excel learns your patterns, organizing your data to save you time. Basically, it saves you time.
In addition, Excel allows you to create tables, new types of charts, and even share data with other people. If you have Office 365, then you will be able to work within an Excel file from mobile, desktop, and web. That will help you get work done faster.
Now, you now can add data to Excel from a photo with the Excel app. Just take a picture with your mobile device and watch it work. If all goes good, then you will have a table to work on in Excel. Overall, it eliminates the need to copy data manually. Great, right?
When working with money, Excel is the place to be. You can organize your finances, savings, all in one place. Also, you gain insights with you set up your money data properly. In the end, you really want to make sure most of your data is set up in a simple manner.