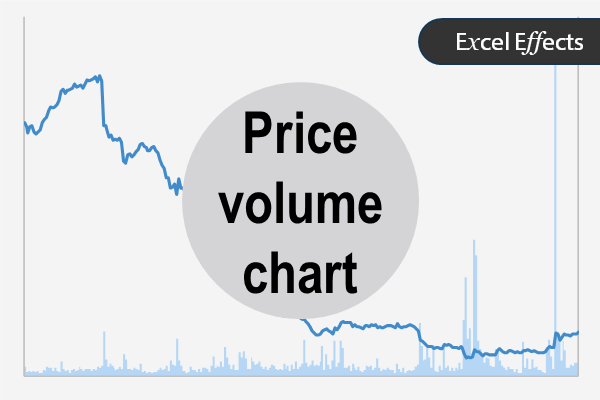
Overview of price volume charts
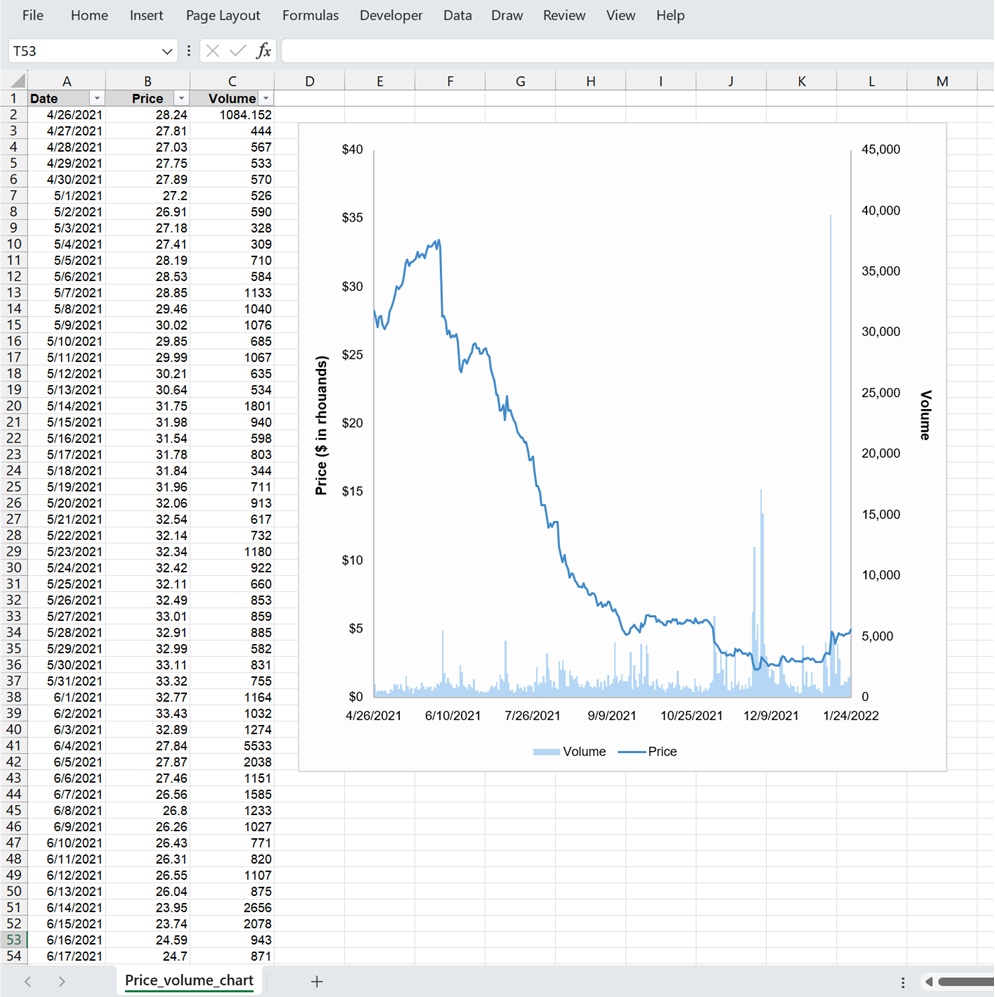
Price volume charts show the relation of shares traded to its price. For the most part, you see this chart in financial institutions, particularly investment banks and the stock market.
Excel is the primary app to create this chart type. However, creating it is not necessarily easy. Therefore, feel free to download this chart and explore its components. If you plan to work in the stock market or a financial institution, then learning this chart is essential.
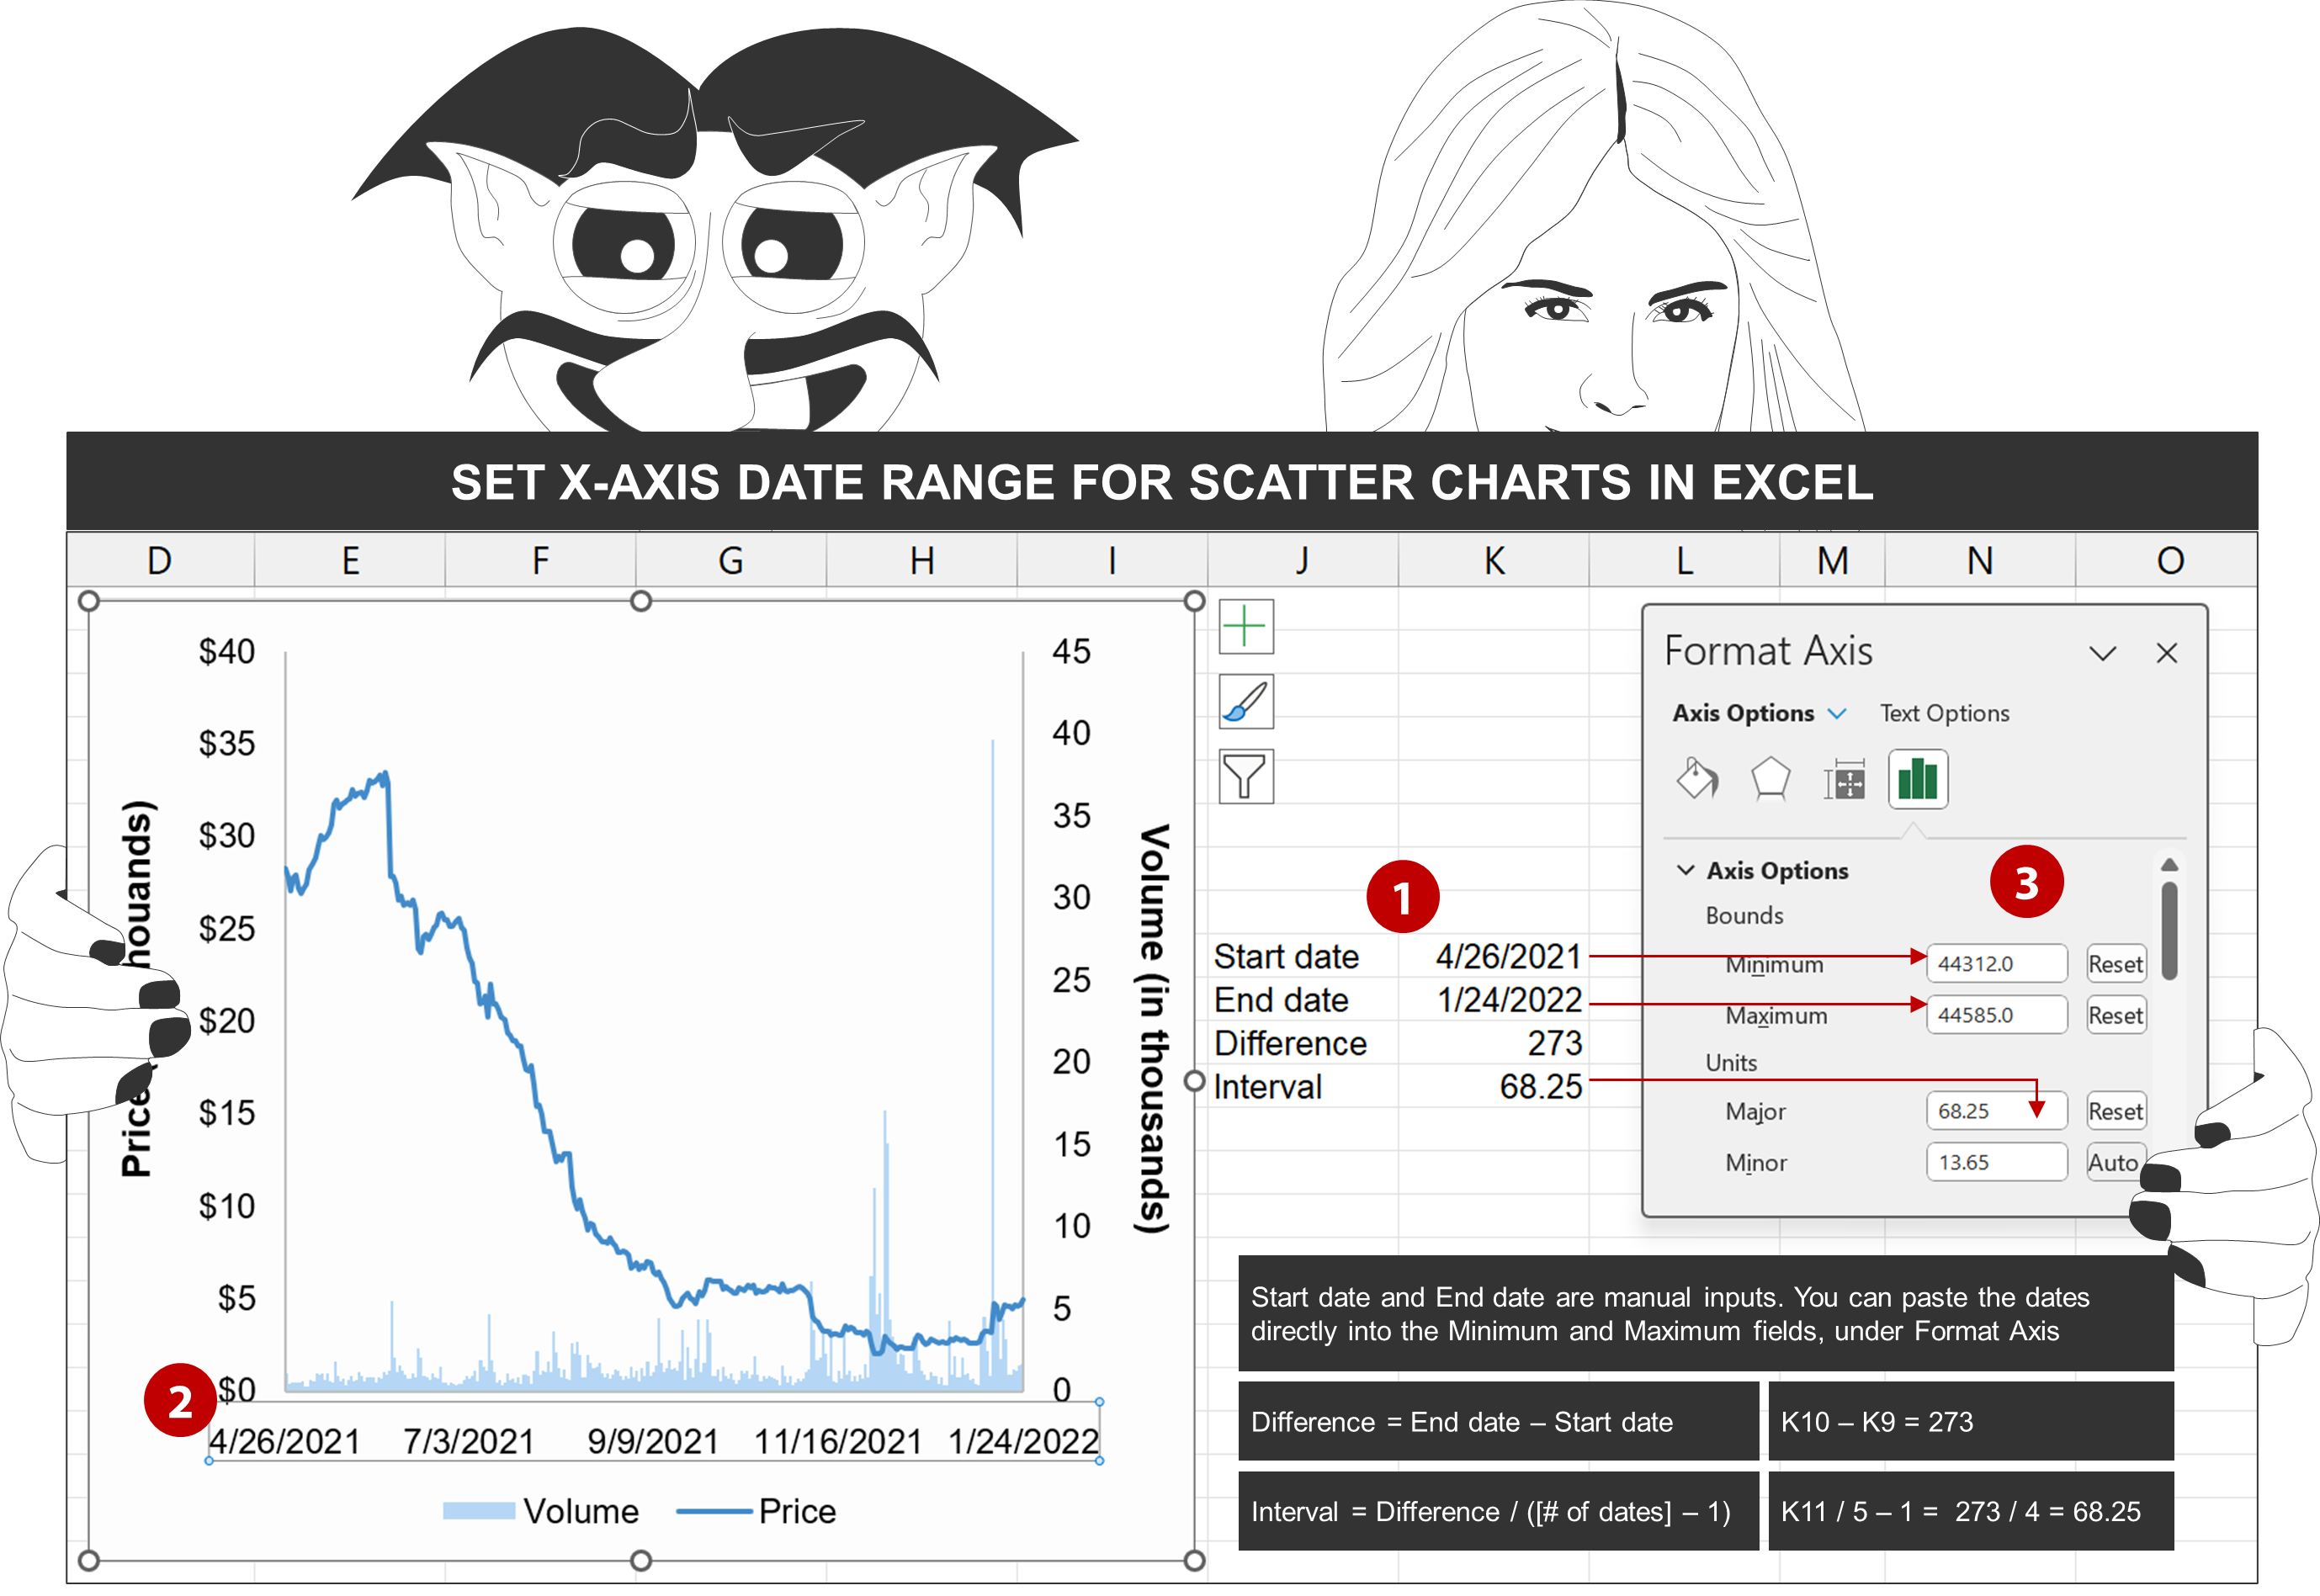
Setting date range
The illustrated snapshot below shows you how to set the date range for this kind of Excel chart. So, the best way to work it is to practice it.
Get the chart
Overall, there are many places to view this chart on the web. Mainly in image form though. On the other hand, you can download it directly from Excel Effects below.
Download
Requirements: Excel 2007 or higher or compatible.
Download Size: 32 kilobytes