Note: The United States Daily Report is a sample dashboard. You can download it and change it for your own purposes. We do not offer support for this product.
Overview of the United States Daily Report
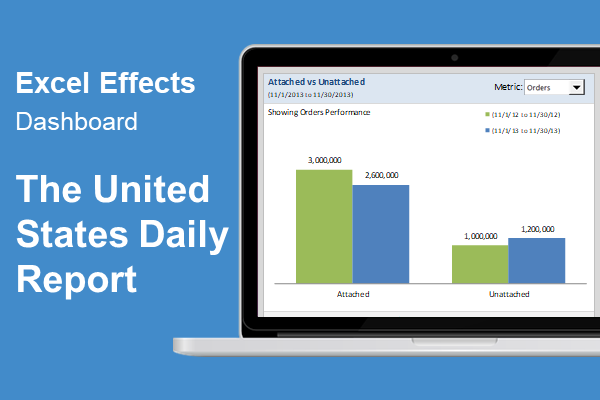
The United States Daily Report (or USDR) is a dynamic dashboard for a major company in New York City.
Note: All of the data in this dashboard is completely fake.
We started this report in Excel 2003 on a Windows operating system. Later, we migrated to Excel 2007. The first version of the report was done in April 2011.
The USDR was a major reporting tool for the company, and took about three months to build. Well, at least for the first working version. So, the first working version only included the overview and daily summary. Later, we added the estimates page and trend analysis summary.
Since the company was slow in migrating from Excel 2003 to Excel 2007, we started the project in Excel 2003. Therefore, we had to use dynamic array formulas. Because, we did not have access to some of the special IF functions.
The USDR is probably the biggest project we ever worked on. However, after this project, it was easier to develop other tools.
Improved productivity
Before creating this dashboard, it took about two hours to update the United States Daily Report, each day. The old report contained about 20 sheets to update. Therefore, we compacted those pages. And now, the USDR takes about 15 minutes to update.
All you have to do is, run an SQL report, update the data in Excel, and watch it go.
Regional issues
For some reason, the 2003 version did not work for users outside of the United States. Perhaps, this was due to the date formats and functions. Originally, the report was meant to be for our United States client, based in New York City.
However, our international base heard about the report and wanted to see it work. Later on, I think they got it to work. Keep that in mind, if you download the report, and it does not work properly for you.
You may need to change your regional settings on your computer. Who wants to go through all that though?
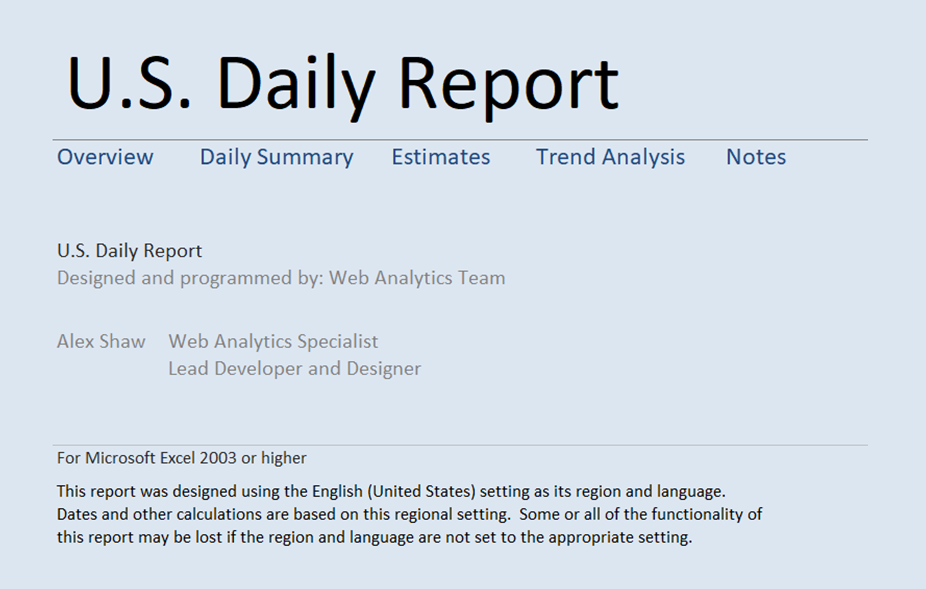
Sections of the USDR
As mentioned above, there are four sections to the USDR. There is also a notes page. But, we added the notes page much later after the first version of the report.
At the top of each section, there is a main selections panel. The main selectors control the entire section. If the panel contains modules, then you may see selections for each module. This makes the dashboards even more dynamic.
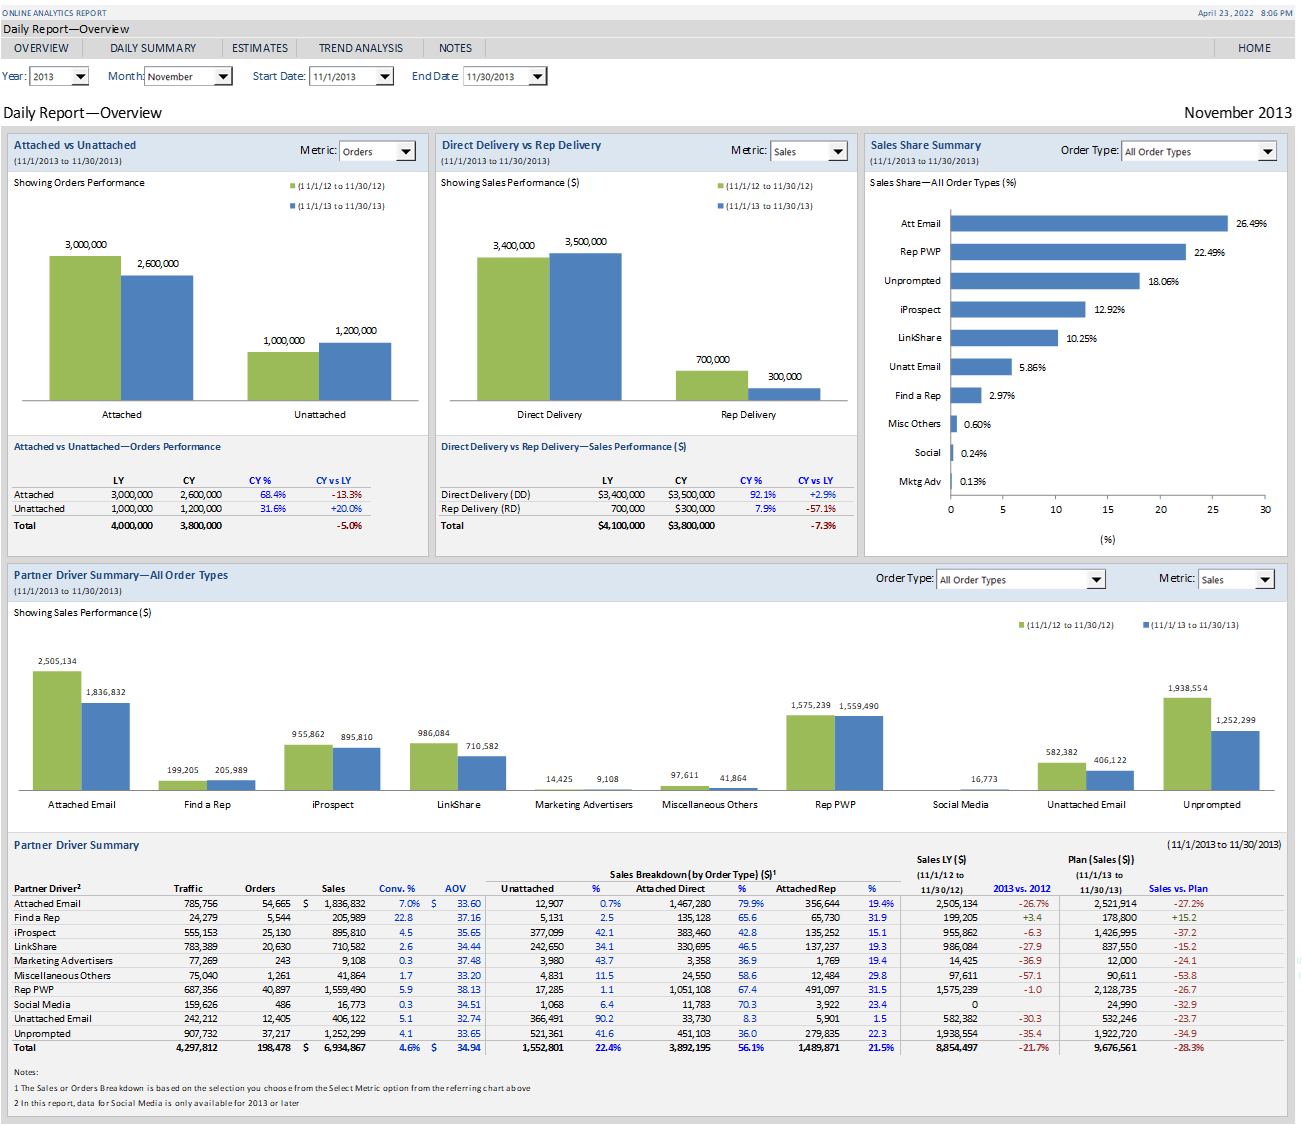
Overview section
So, the overview section is perhaps the main part of the report where people get their metrics. Overall, it has almost everything you need in a visual summary. Including, a summary for 3 of the 4 modules.
Daily summary section
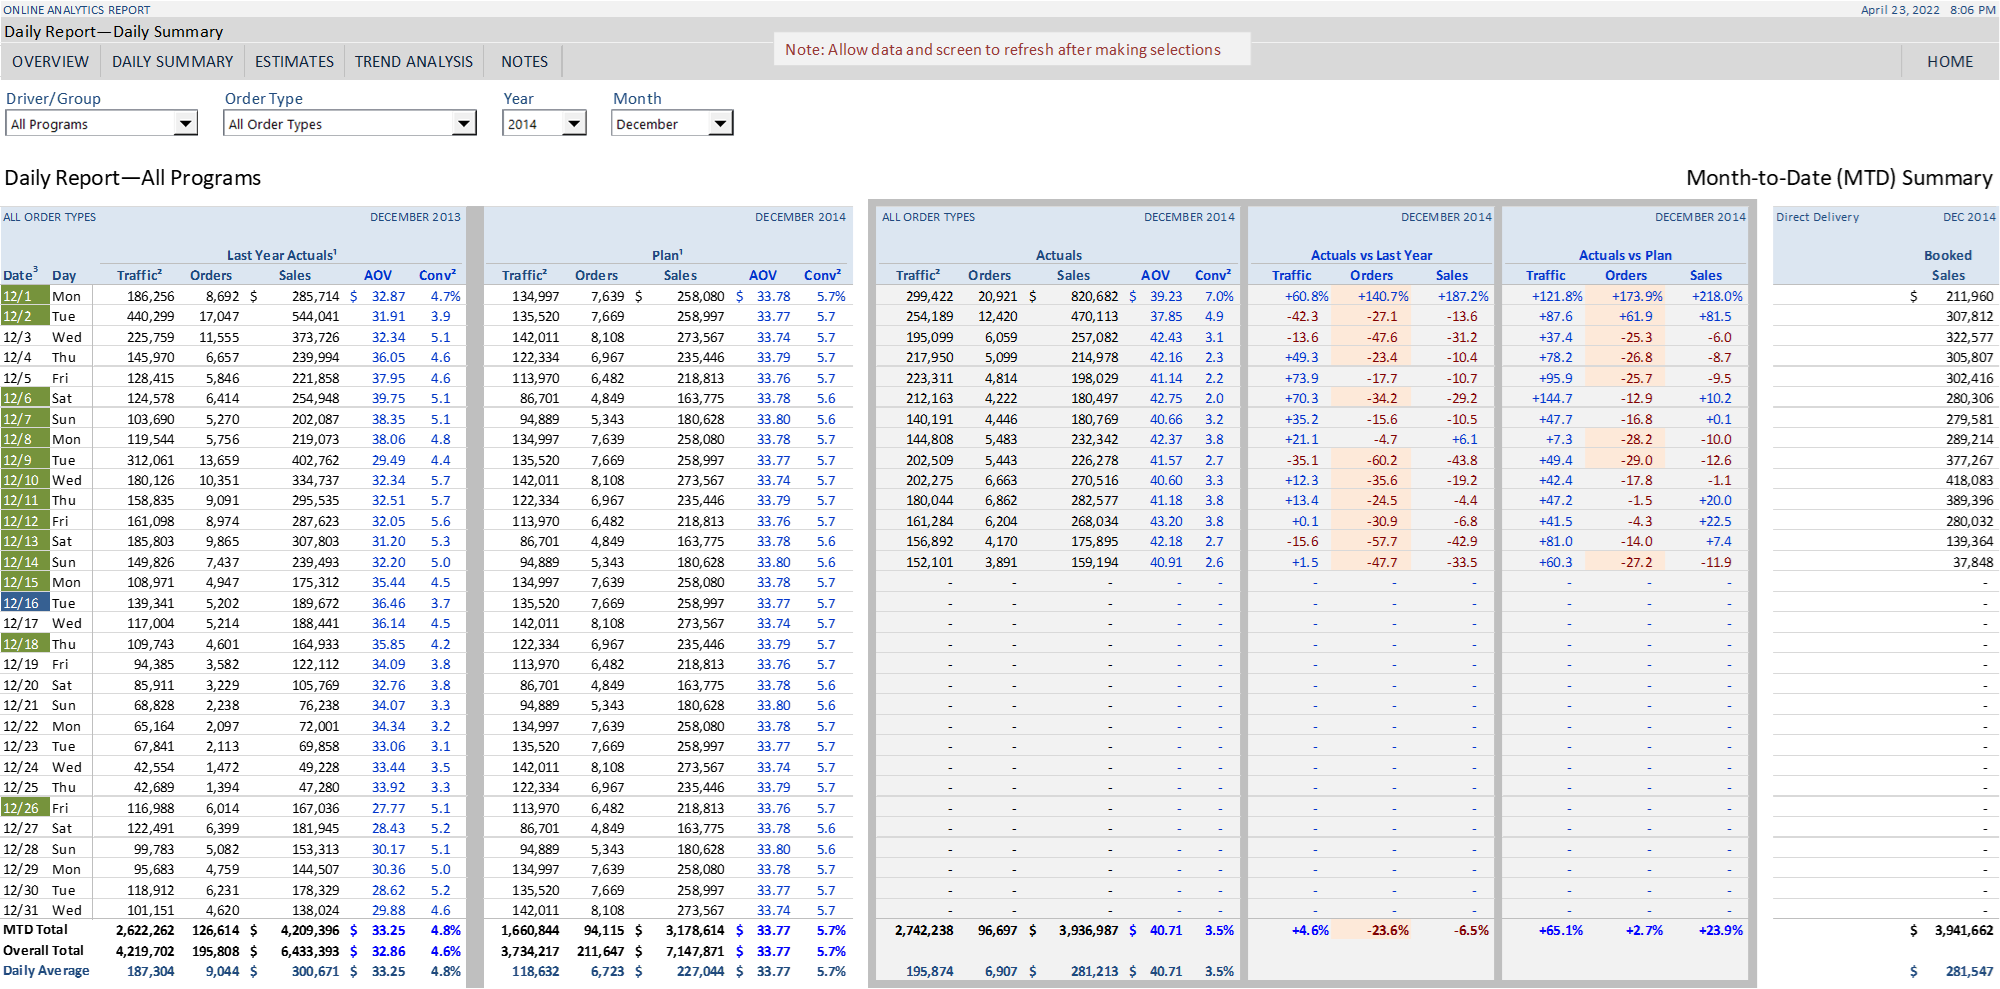
The daily summary section contains a lot of detail. And, it is divided into four parts: Last year actuals, the plan, current actuals and comparisons, and direct delivery. Yes, it is a lot.
So, the plan part is what it is. It does not change. The plan is done months before the current year, and does not change. We added a direct delivery column mainly for our logistics person.
Of course, we compare last year to current year, as well as to the plan.
Estimates section
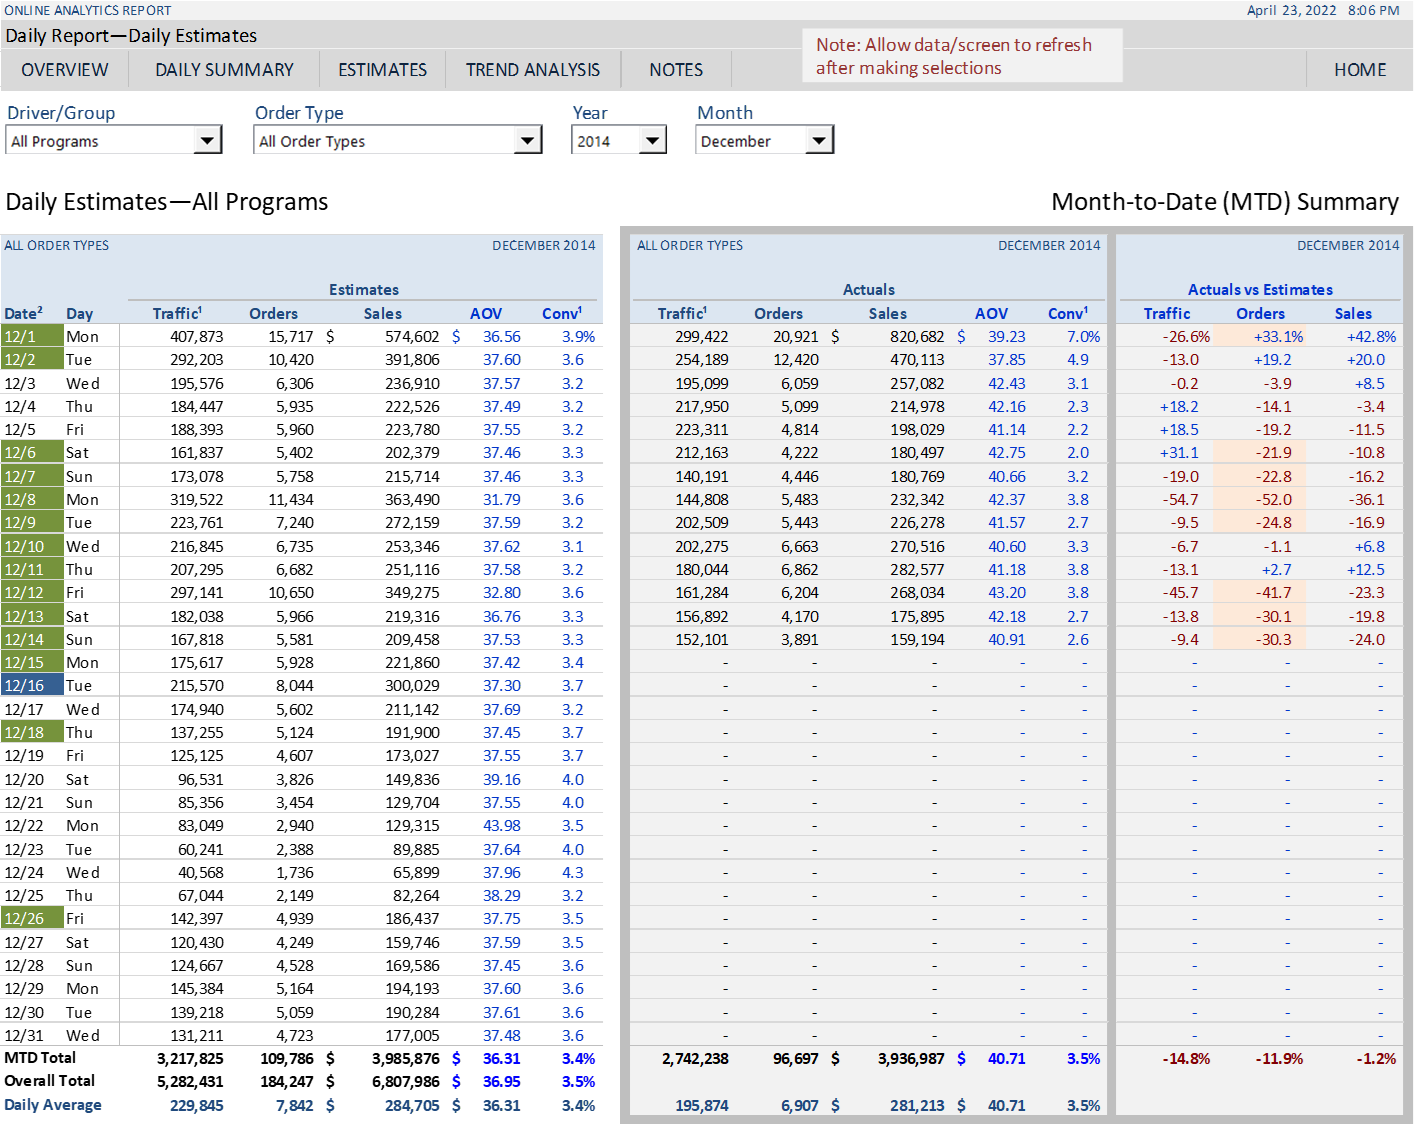
Now, the estimates section is similar to our daily summary. However, it is a more compact summary. So, the reason why we have an estimates section is because we cannot change the plan.
Initially, the estimates start off with the same values of the plan. But the owner of each plan gets to change the estimates for any day of the year. And, they can even do it as late as the day before a launch of an event. Or, even the day before the report run.
Trend analysis section
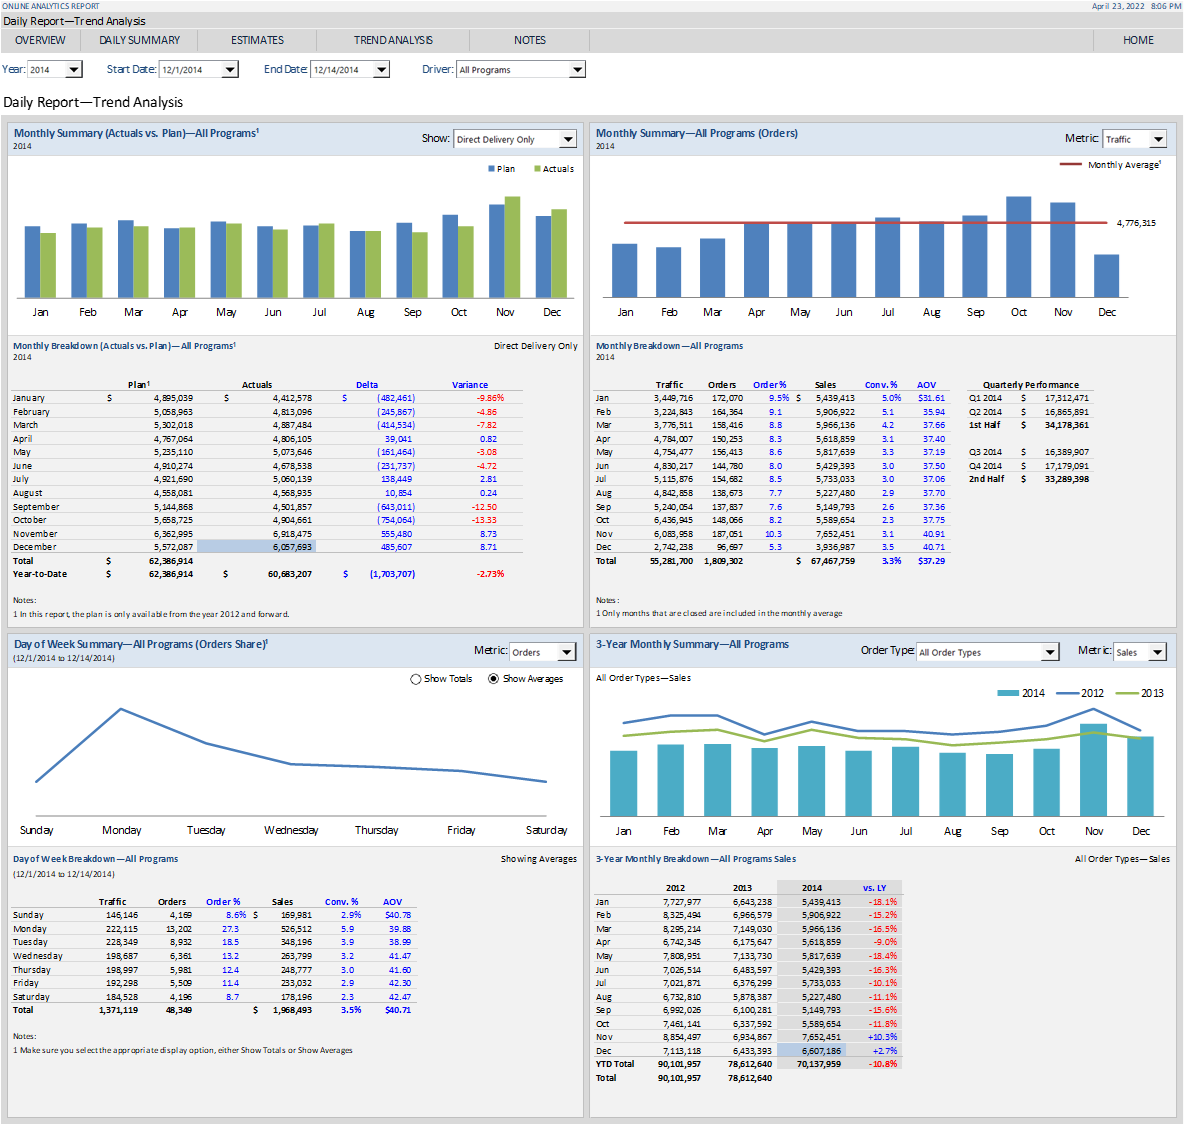
The trend analysis section is almost redundant. Essentially, you can just about do the same comparisons in the other section. However, it always help to have a more visual way of viewing the data.
So, within this section, you get to analyze the data across specific periods of time.
Notes section
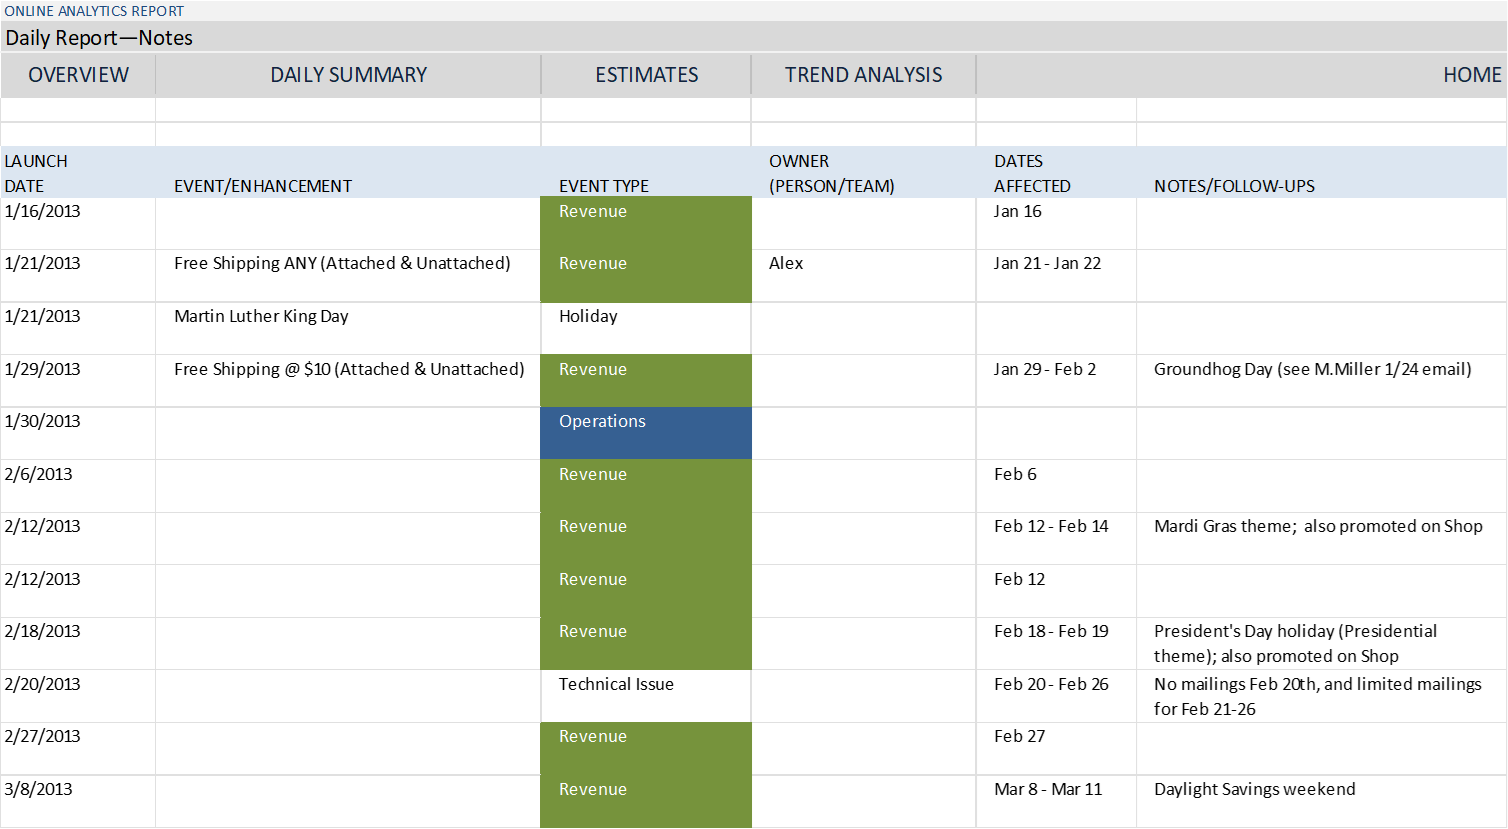
So, the notes section is where certain users get to add their input to the report. Basically, they add special dates for events. Each event type is color coded. In addition, the color code is added to the daily and estimates section. If you look at the date column for each of those sections, then you will see a color for that event.
Although the marketing team should know a special day, this part still helps them analyze the data better. Also, if you look at the performance for the color coded days, you will probably see an upward spike.
Checks and balances
It was fairly easy to test the United States Daily Report. Basically, say if you make a date range or monthly selection, in the overview section. The totals from the rest of the sections should all equal whatever you select in any module.
Also, we could filter the data directly to check and test the report. Good stuff!
Behind the scenes of the United States Daily Report
To get the report to run, you need an engine and gas. Possibly, you can look at the data and our references section as the gas and part of the engine.
The daily data
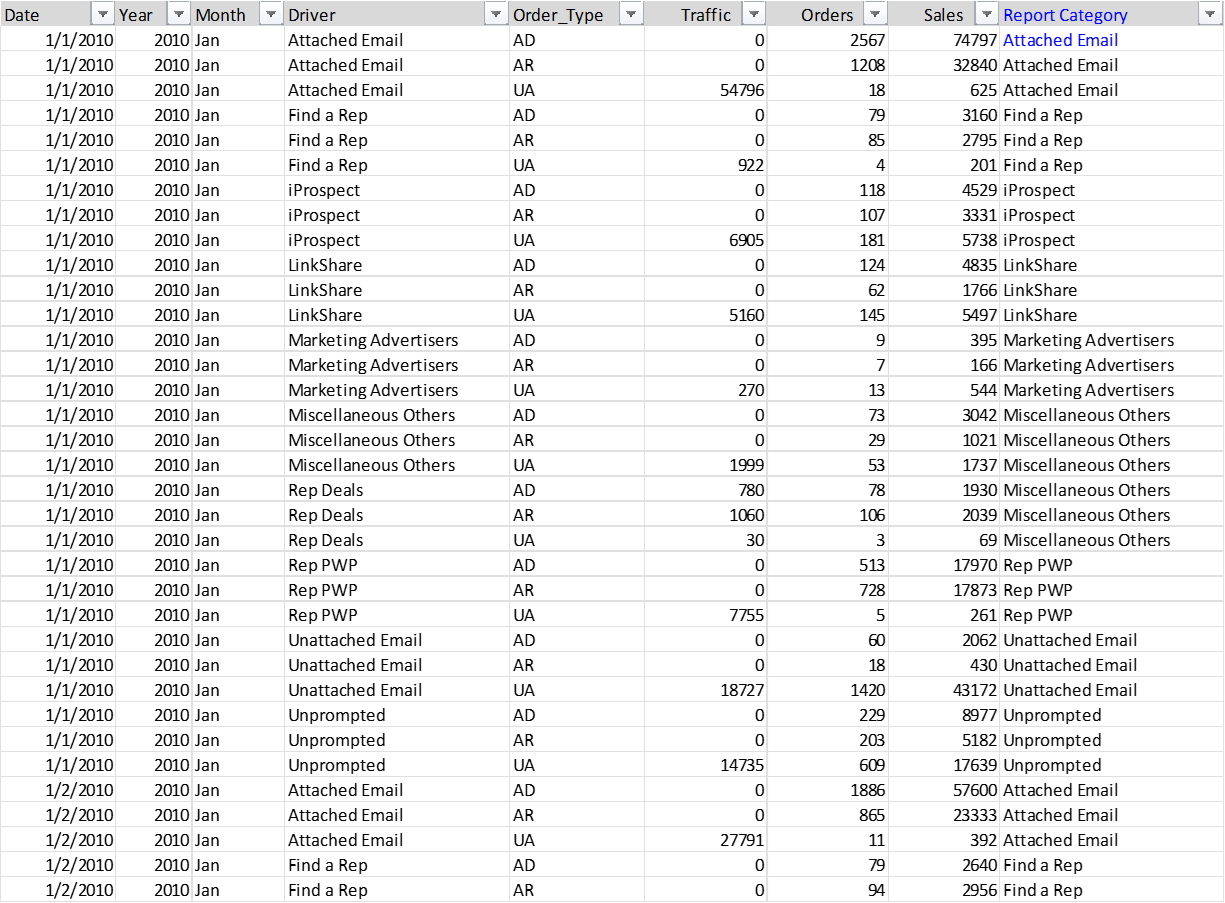
In addition to the daily data, we have separate data pages for the forecast and the plan. Keep in mind, you are getting this report raw.
References and user selections
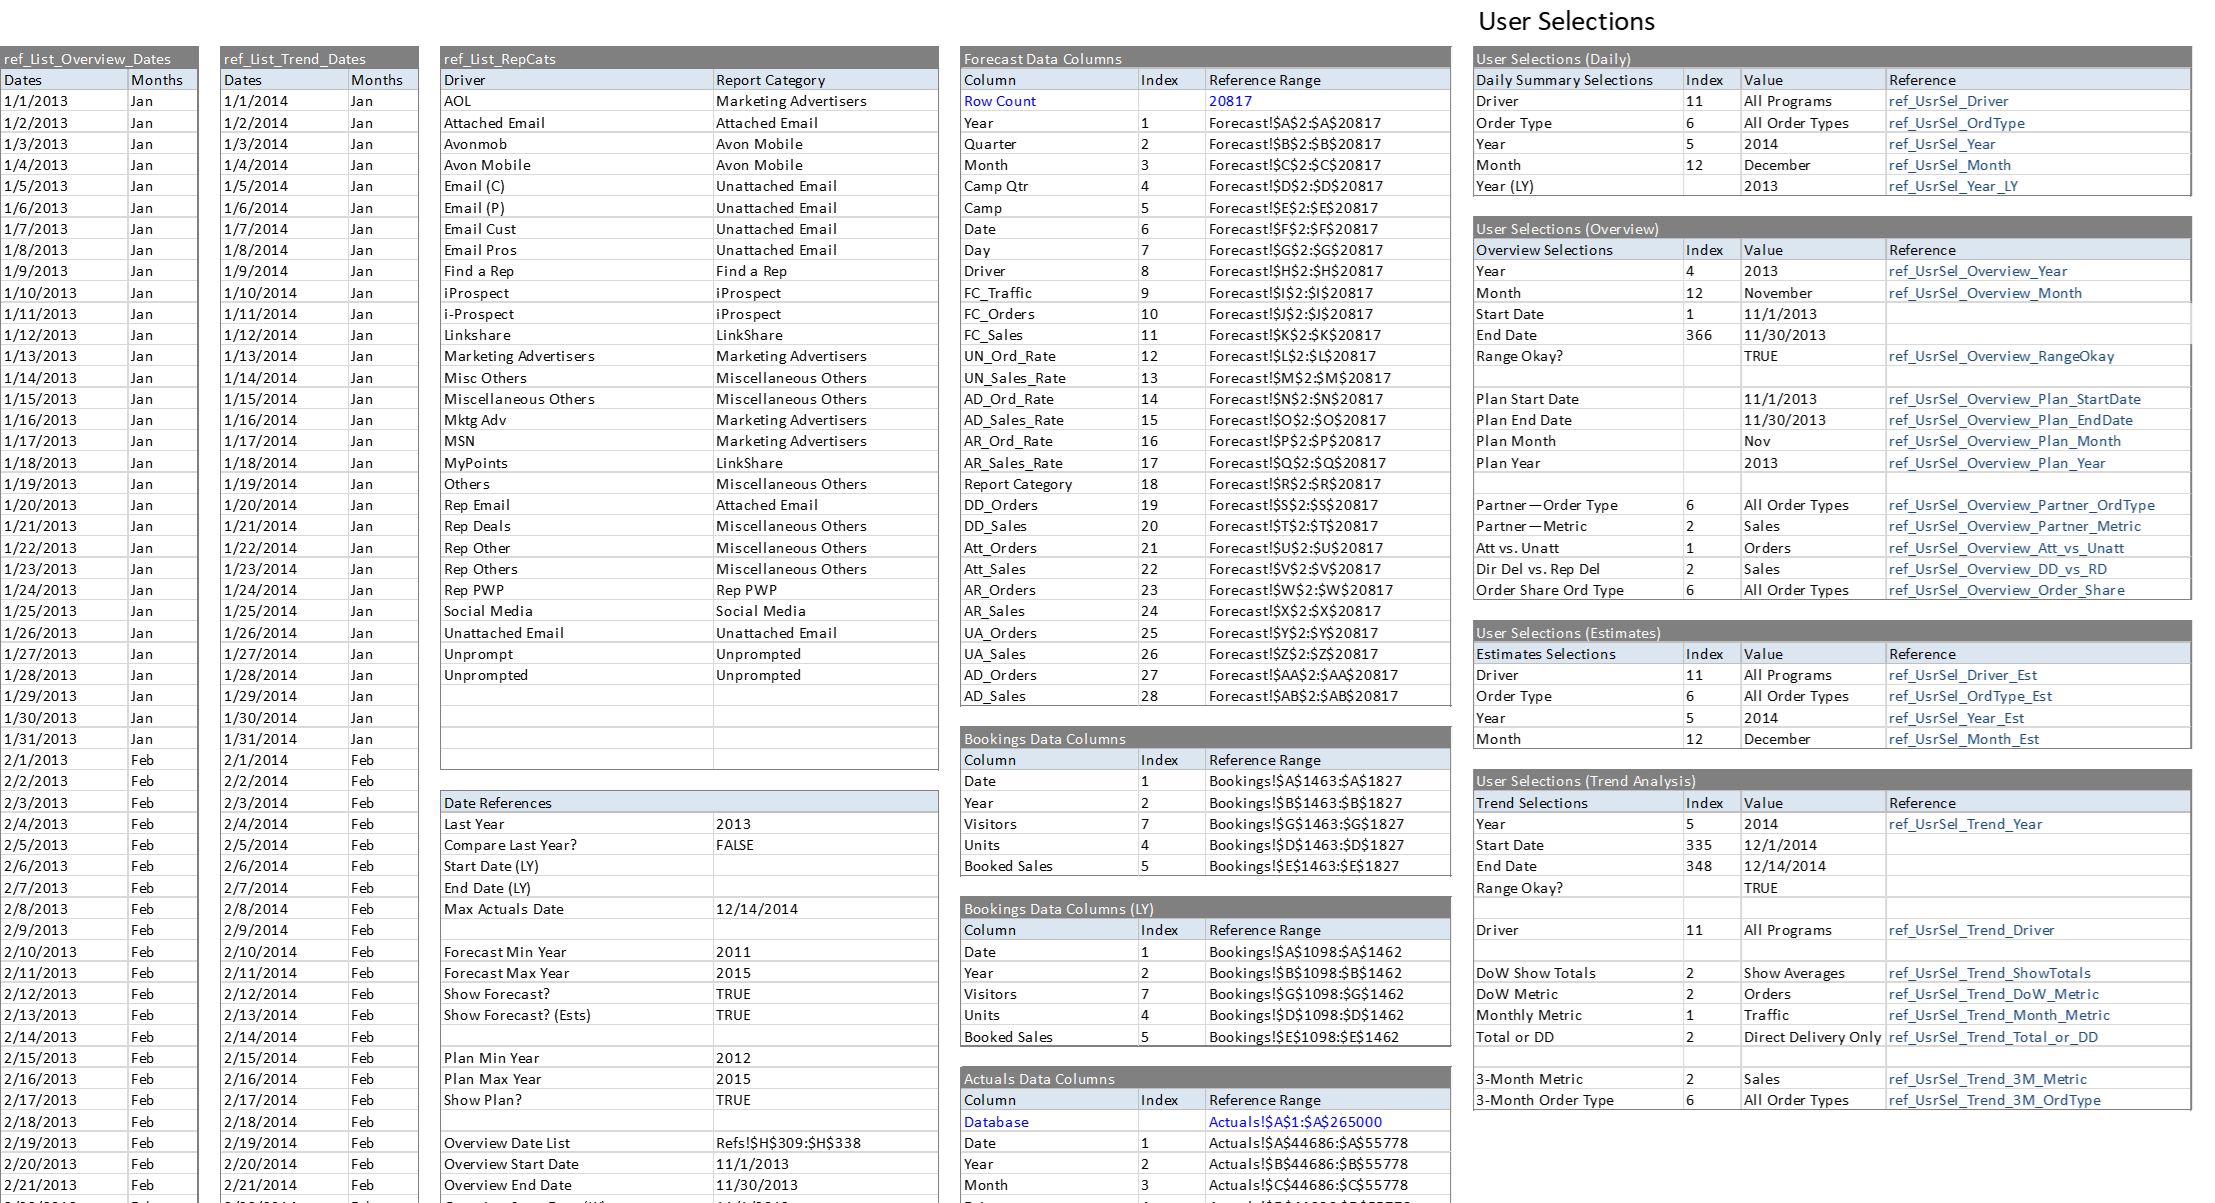
If you are really into Excel, then this section will have you out of control. Overall, the references and user selections contains all the lists and criteria for all user selections. Moreover, it stores the selections that each user makes.
That good part is, multiple users can open the USDR at the same time.
The user does not have access to the data pages or the reference section. However, you get full access to the entire report.
Video of the USDR
Below is a video showcasing the elements of the USDR. Keep in mind, the video may take a while to load on certain systems.
Download
Click on the button below to download the USDR.
Requirements: Excel 2007 or higher or compatible.
Download
File size: 6.82 Megabytes