Dashboards
Overall, dashboards are user-interfaces that allow you to view and analyze data at-a-glance. Usually, with key performance indicators and other metrics.
United States Daily Report
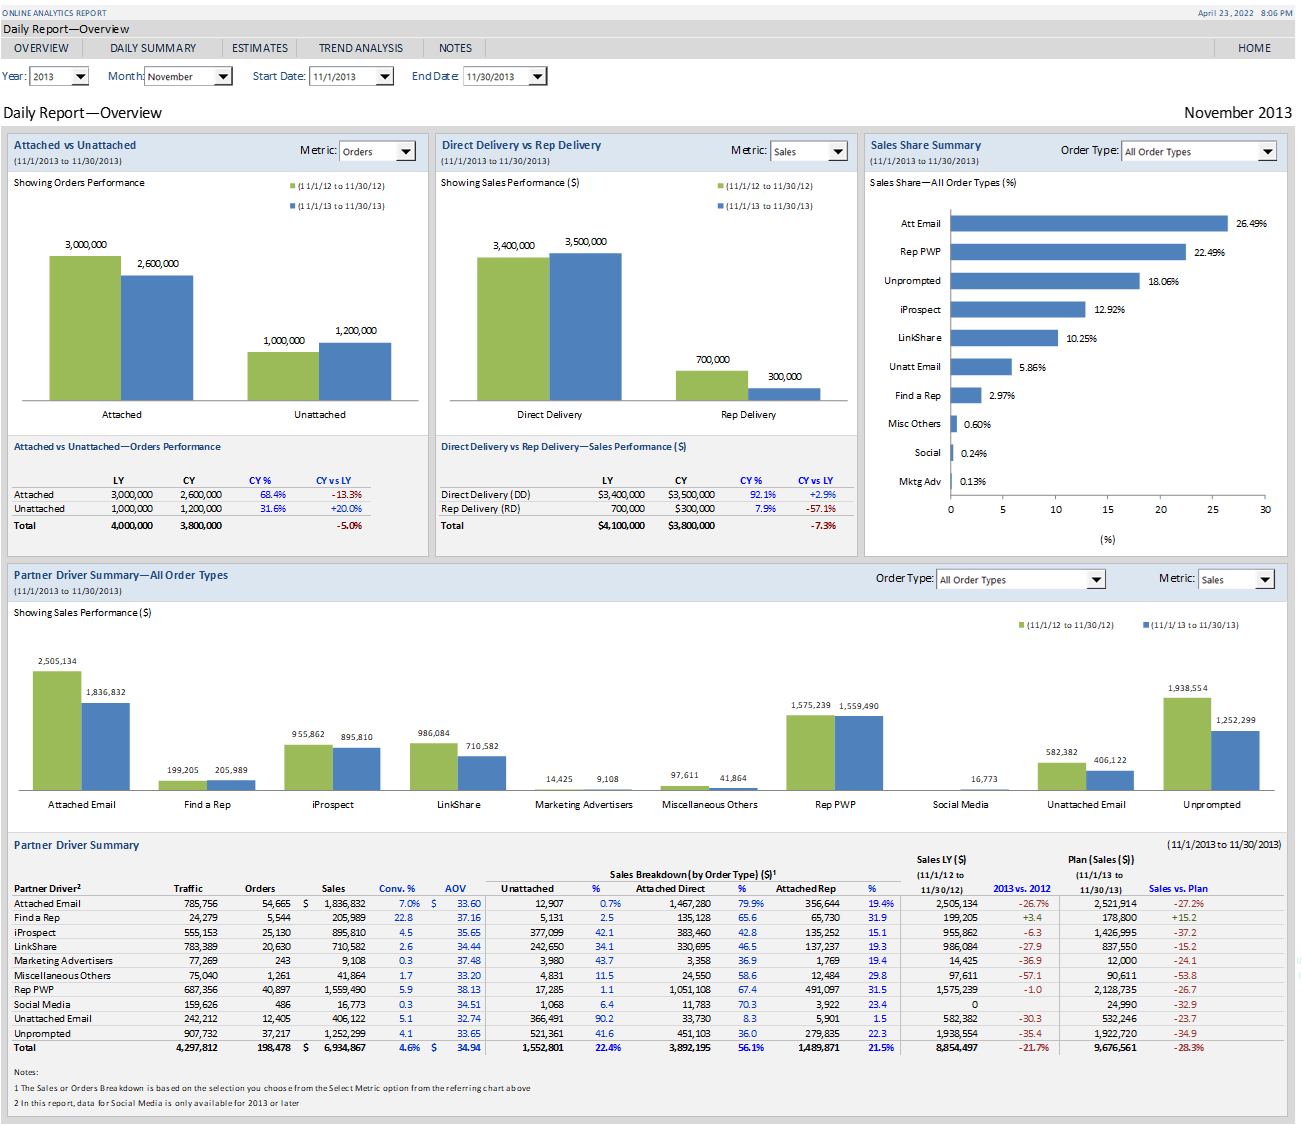
The United States Daily Report is a custom reporting tool for a company in New York City. It is a perfect example of a dashboard, allowing you to make all types of comparisons. You are free to download this dashboard, to learn what you can do with a real reporting tool. Keep in mind, we developed this tool in 2012, in Excel 2007.
Note: All the data in this report is fake.
Learn more and download
If you want to learn more about the US Daily Report, and download it, then click on the button below.


