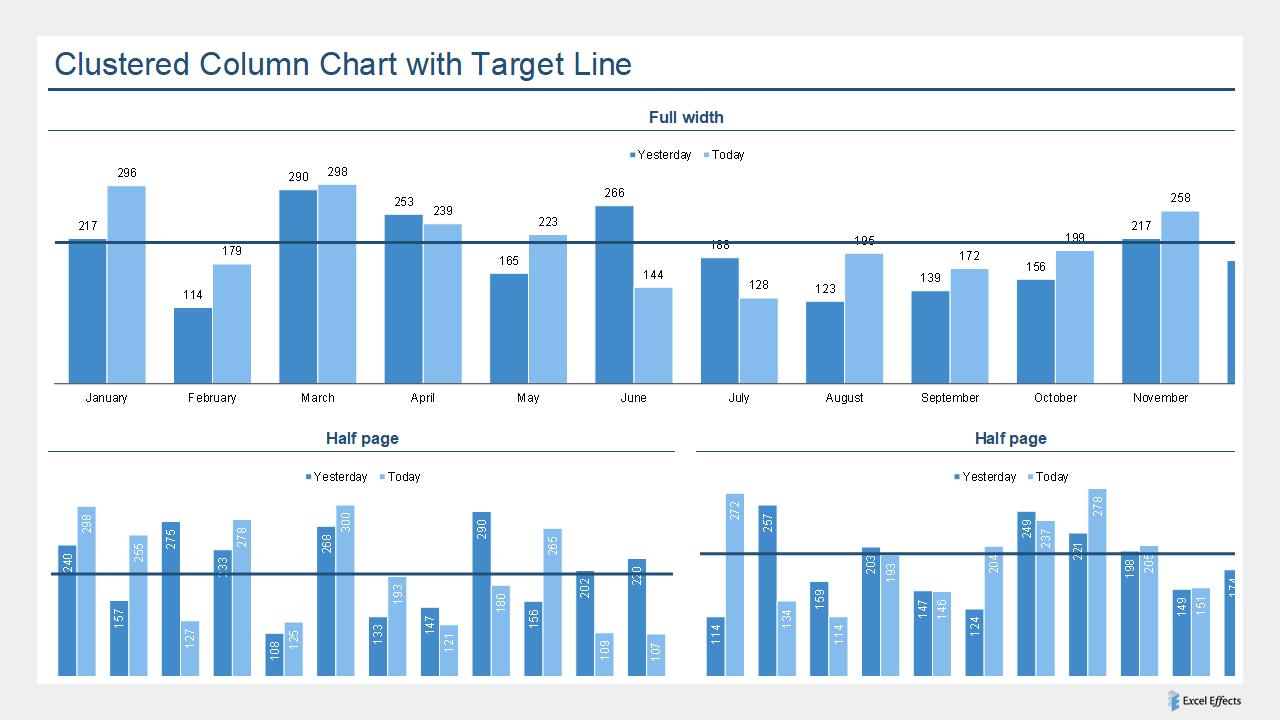
Overview of the clustered column chart with target line
The clustered column chart with target line allows you to compare multiple series to a particular goal. Also, notice how we have the target line go across the entire plot area. Moreover, it is all data generated. Of course, when you download the tool, it is almost like plug-and-play. Just enter your data and watch it go.
Download
Requirements: Excel 2007 or higher or compatible.
Download
Size: 24 kB