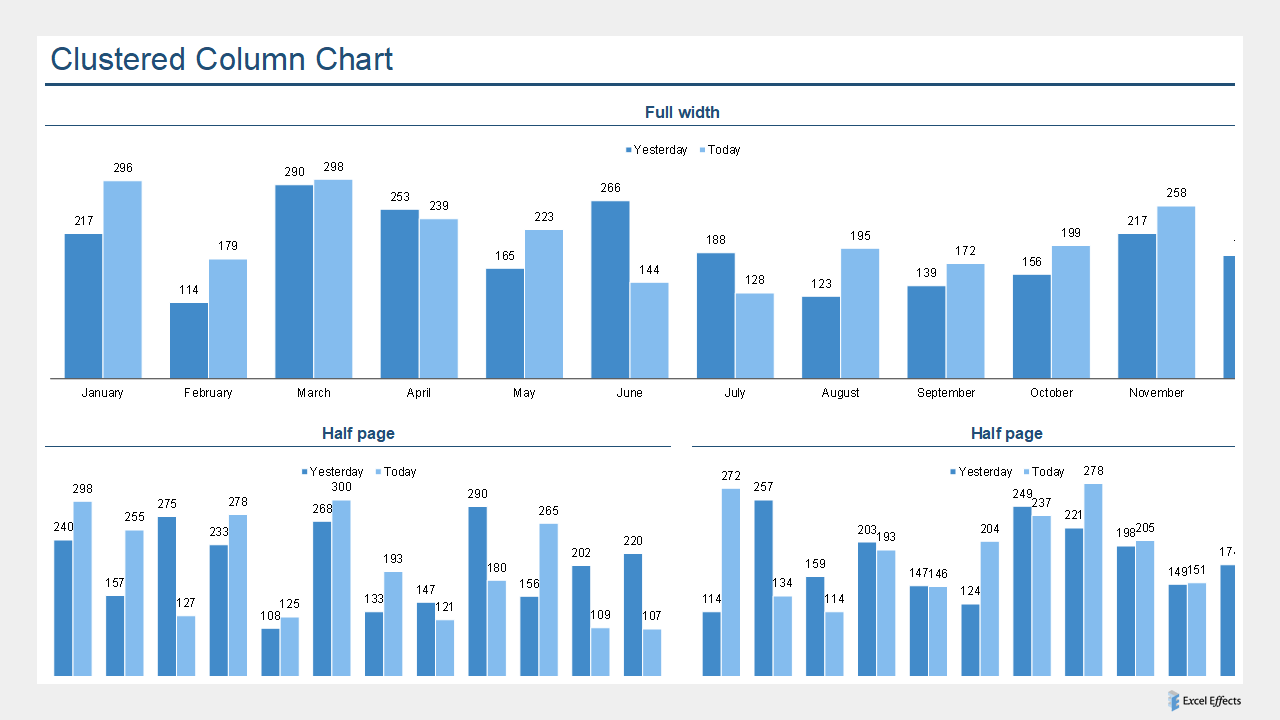
Overview of the clustered column chart
The clustered column chart is very similar to the standard column. Instead, it has additional columns, side-by-side, forming a cluster. This type of tool is good for comparing values of the same data type in similar periods. Also, notice that we include a legend to distinguish between the series.
Download
Requirements: Excel 2007 or higher or compatible.
Download
Size: 22 kB