Overview of the thermometer experiment in Excel
So, we came up with the idea of creating a nice thermometer in Excel. Honestly, we surprise ourselves with these creations. Now, we feel like we can design anything, which is good. Although this thermometer works perfectly on our end, we still categorize it as an experiment.
Therefore, it is up to you to decide what to do with it. We have some ideas. But for now, we will keep it a secret.
How it works
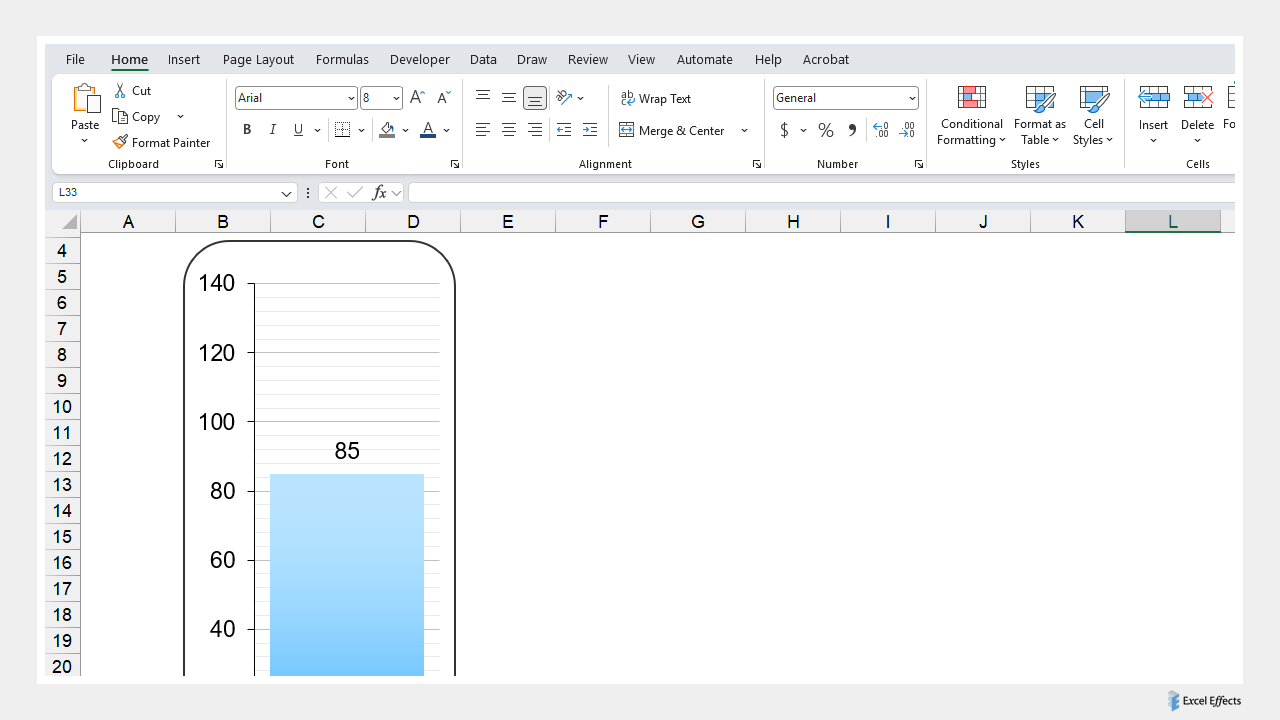
The main engine behind the thermometer is a column chart. Below the chart is a slider that adjusts a number in the range of 0 to 140. Furthermore, we use a few shapes within the chart area to make the tool look more sleek.
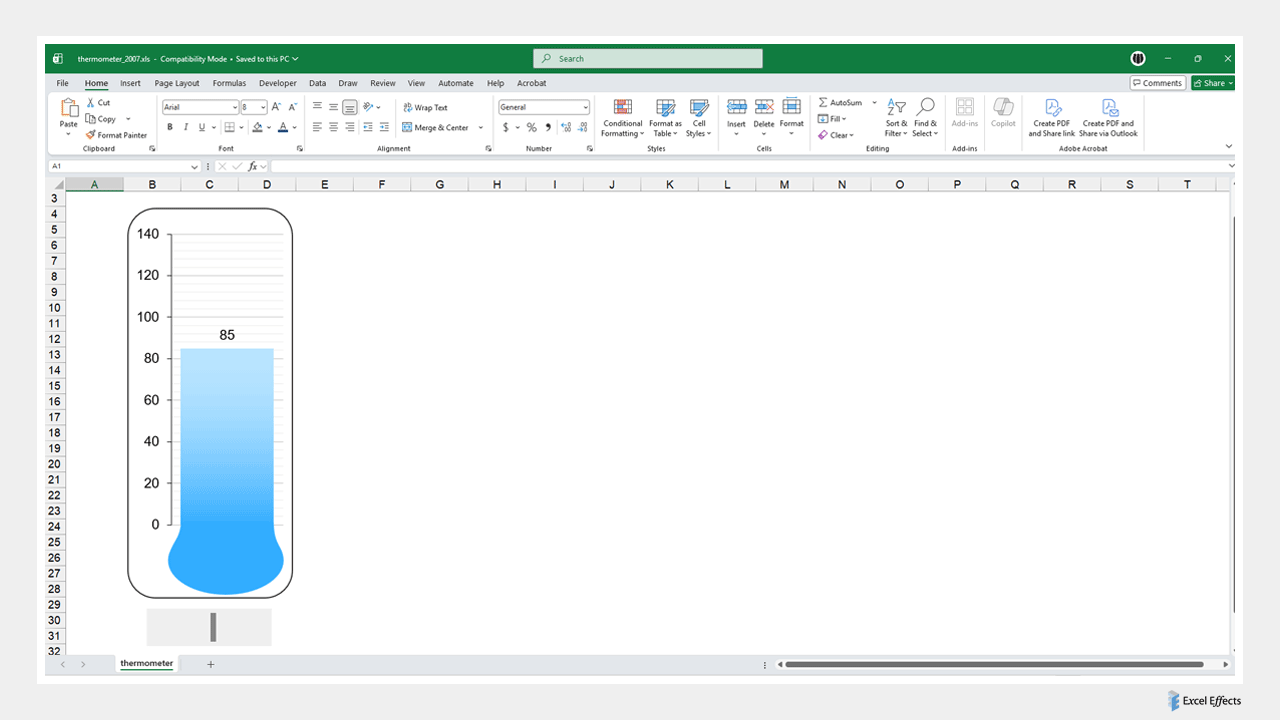
The complete picture
Since you cannot really see the entire tool, take a look at below. Again, it is up to you.
Download
Requirements: Excel 2003 or higher or compatible.
Download
Size: 11 kB