Overview of the sunburst chart
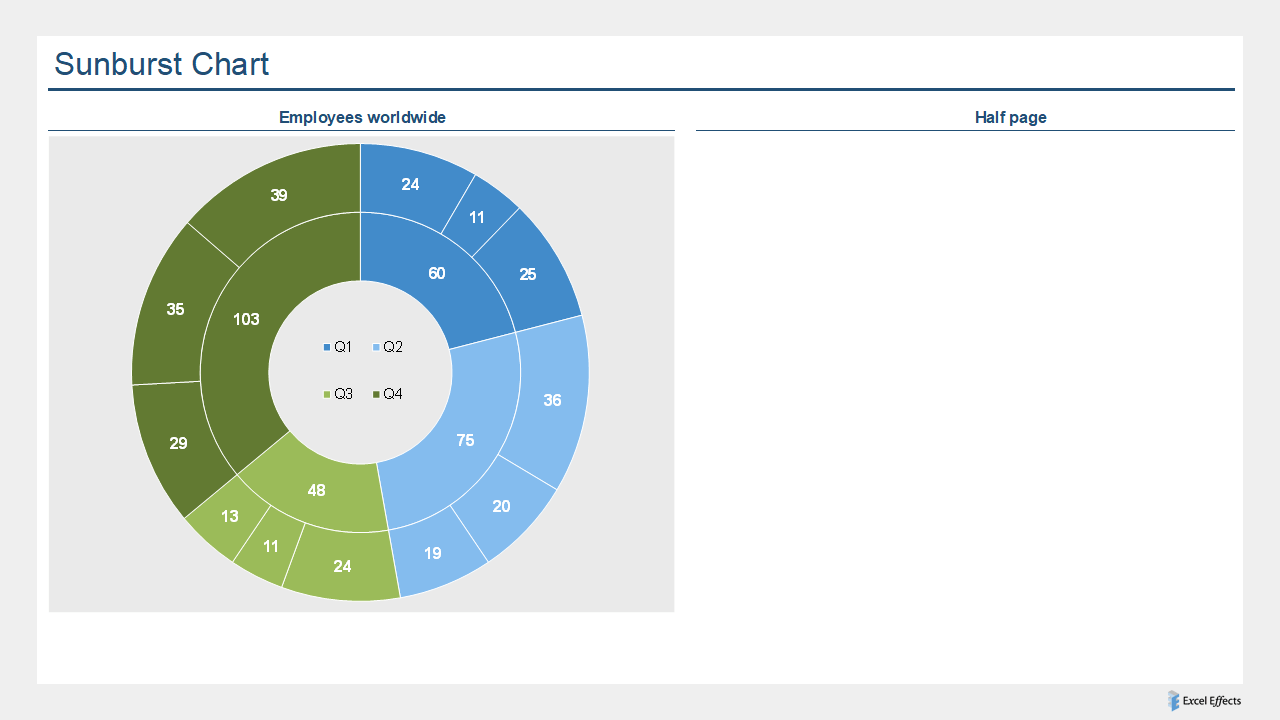
The sunburst chart is a creative way to show parts of a whole in a circular fashion. This type of tool could be tricky to design. So, we took the liberty of making one for you. Basically, it is a donut chart with multiple series. Hopefully, this will help you get off to the right start.
Download
Requirements: Excel 2007 or higher or compatible
Download
Size: 15 kB