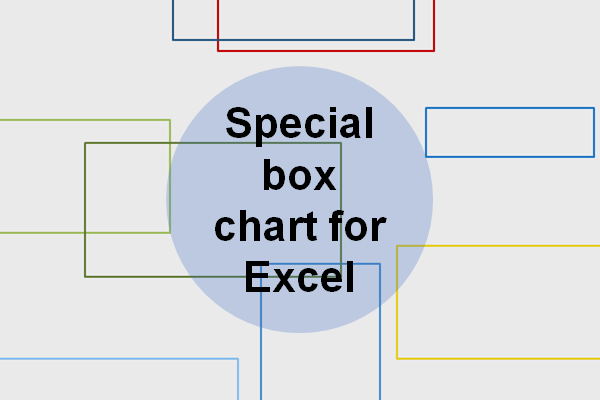
The special box chart for Microsoft Excel
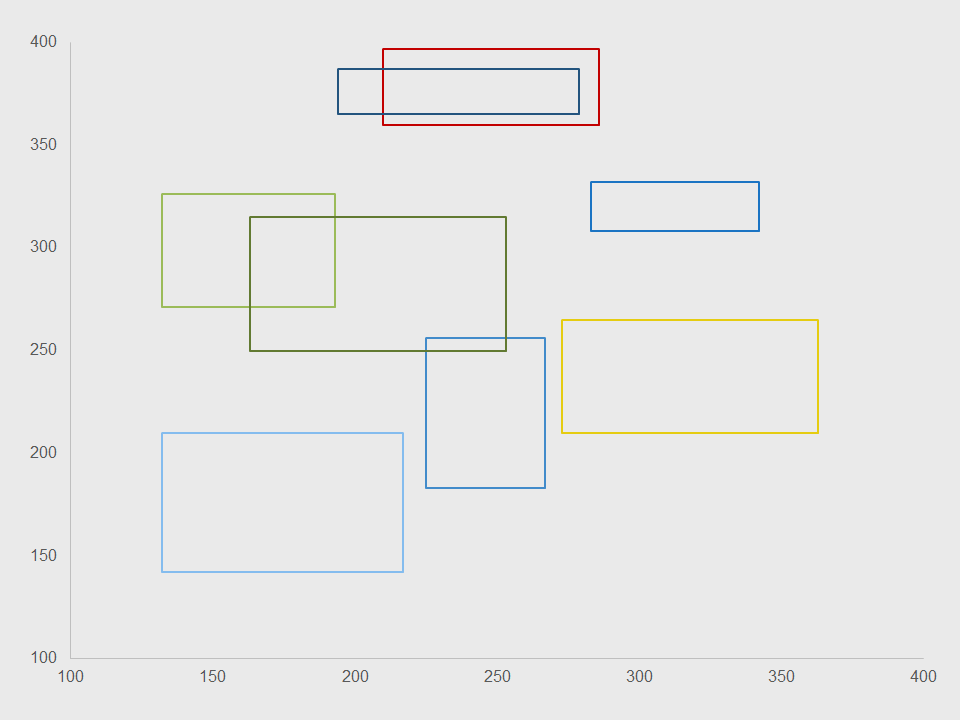
Very similar to a bubble graph, the special box chart allows you to specify a starting point and an ending point. Moreover, it also does not matter if your starting point is less than or greater than your ending point. Still, it plots both points.
About the chart
So, we once got this request from an investment banker to create a boxes as a chart, like (x1, y1) to (x2, y2). However, he wanted the box filled with color. Unfortunately, the fill part was not possible. At least, from our perspective, without using VBA.
Most likely, the fill part would be difficult because we are connecting point-to-point. Even if the shape closes, technically, it is still not a box.
Going forward, we may look into making the box fill option in Excel.
Download
Requirements: Microsoft Excel 2007 or higher or compatible.
Download
File size: 20.3 kilobytes