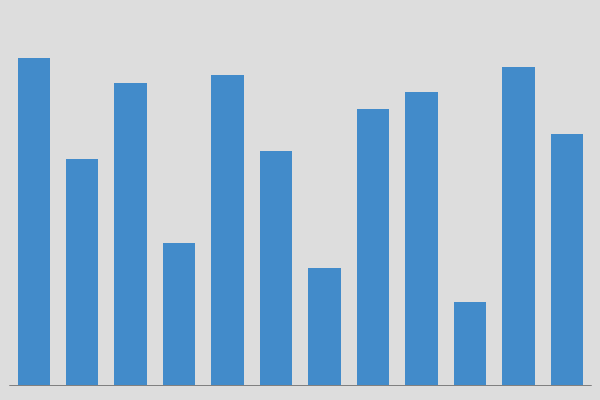
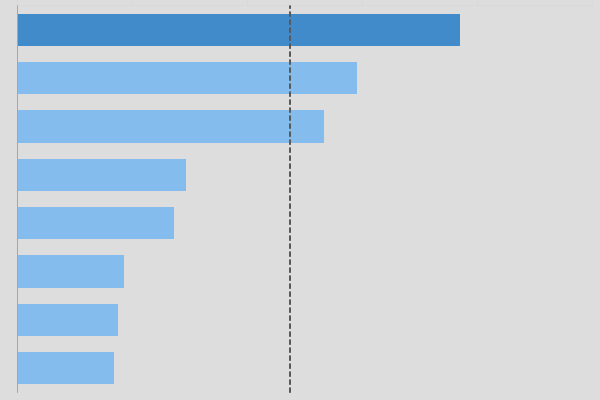
Blank canvas of Excel
Firstly, when we start a design or project in Excel, we look at it as a blank canvas. It is such a beautiful thing. Reference guide Education home Excel Effects home
The bubble chart with trend line. Download The bubble chart with trend line In the past, bubble charts got on my first and last nerve. Perhaps, it was due to the kind of bubble graphs that I had to work with. Mostly, these graphs had like hundreds of bubbles in it. Moreover, each time someone […]
This quick video tip shows you how to change cells from night to day in Excel. Change cells from night to day in Excel In this instance, we use a macro to accomplish this task. So, what we do is record the process of selecting all the cells in the sheet. Then, we change the […]
Chart Switcher for Excel The Chart Switcher is a tool for Excel 2003. Originally, it was an experiment to see if we can update the source of a chart from a user’s selection. We plan to keep it in the experiment category, as a vintage tool. If you click in cell B6, then a dropdown […]
The clustered column chart. Download Overview of the clustered column chart The clustered column chart is perhaps the most widely used chart in business. In general, it has a basic appearance. However, you get an excellent visual of your data in a very simple form. Some like to compare this graph to a pie chart […]
Clustered column chart with scatter chart for Excel The clustered column chart with scatter chart definitely a special combination chart. Requirements Microsoft Excel 2007 or higher or compatible. Download Chart library Excel Effects home Charts As you may know, charts help you show data and information to your audience in a more visual manner. In […]
Clustered high low chart for Microsoft Excel The clustered high low chart for Microsoft Excel looks like a race to the finish. So, you have high and low comparisons across a series of categories. Requirements Microsoft Excel 2007 or higher or compatible. Download Chart library Excel Effects home Charts As you may know, charts help […]
Clustered high low chart with average line for Excel The clustered high low chart with average line for Excel has two average lines. And, both lines stretch across the entire series. Requirements Microsoft Excel 2007 or higher or compatible. Download Chart library Excel Effects home Charts As you may know, charts help you show data […]
Clustered stacked column and column chart for Excel The clustered stacked column and column chart for Excel is a nice looking chart. Basically, you have a stacked column right next to a regular column. Requirements Microsoft Excel 2007 or higher or compatible. Download Chart library Excel Effects home Charts As you may know, charts help […]
Clustered stacked with two-row category axis The clustered stacked with two-row category axis is kind of a unique chart. First, it has a side-by-side stacked column. Secondly, it has a two-row category axis. Requirements Microsoft Excel 2007 or higher or compatible. Download Chart library Excel Effects home Charts As you may know, charts help you […]
Clustered stacked-by-stacked column chart for Excel The Clustered stacked-by-stacked column chart for Excel. As you see, we have two series, and separate category titles for each column. Requirements Microsoft Excel 2007 or higher or compatible. Download Chart library Excel Effects home Charts As you may know, charts help you show data and information to your […]
Color scheme table If we recall, then this table is from the original Excel 2007 color scheme. The standard colors may be different today. So, feel free to download it and update it for your own purposes. The good part about this table is that you get to view the darker and lighter versions of […]