Charts

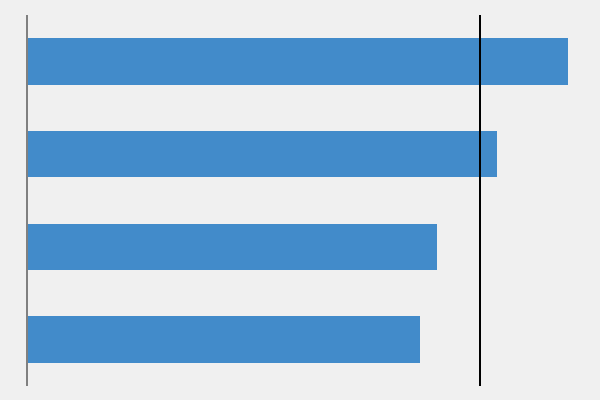
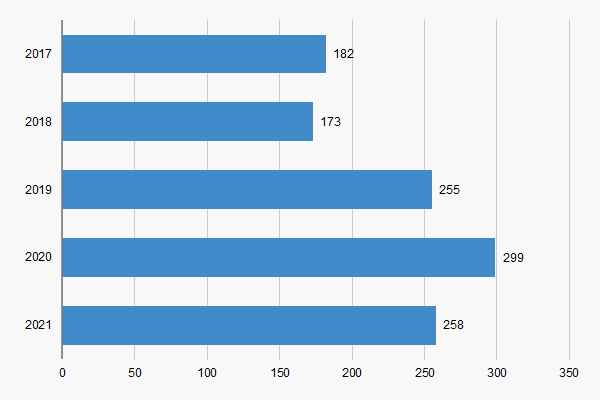
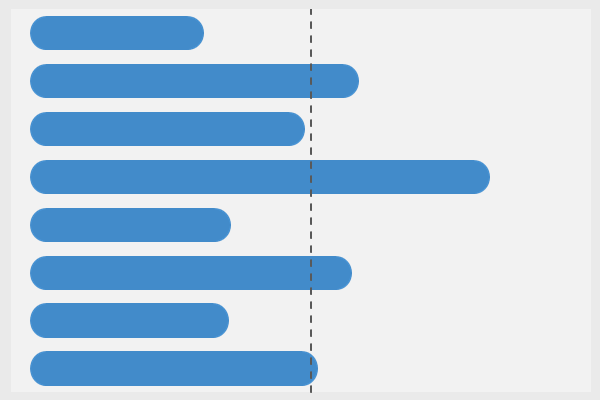
Pill Bar with average line chart for Excel

Pill Bar overview The pill bar with average line chart is similar to a regular bar chart. Instead, with this chart, the two endpoints are round. Thus, you get what looks like a pill. Of course, as with the bar chart, this chart is shows everything in a horizontal manner. Now, with all that said, […]

Rounded Column Chart with Average Line

The rounded column chart with average line is very similar to our column with average line chart. Basically, it shows data across categories. In addition, the average line shows the central tendency of the values. Moreover, you can visually view which categories are above or below average. Adjusting the Rounded Top Now, depending on the […]

Scatter line chart with key stat lines for Excel

Scatter line chart with key stat lines for Excel The scatter line chart allows you to measure data in both directions, horizontally and vertically. Or, on an x/y scale. This kind of chart gives you more formatting options from a regular line chart. Overall, this chart is very popular in financial firms, particularly, investment banks. […]

The butterfly chart for Microsoft Excel

The butterfly chart. Download Overview of the butterfly chart So, before you say, that is a tornado chart, or a football chart, yes, we know about the alternative names too. However, we like the name butterfly the best. On the whole, it sounds better than the other two options. If you create this chart right […]

The Marimekko – Two-level chart for Excel

The Marimekko – Two-level chart Believe it or not, the Marimekko – two-level chart, is actually a stacked area chart in Excel. It is very similar to our one-level version. Overall, it is a unique chart. As with the one-level, there is a learning curve. Unfortunately, you have to update the chart data manually, in […]

The special box chart for Microsoft Excel

The special box chart for Microsoft Excel Very similar to a bubble graph, the special box chart allows you to specify a starting point and an ending point. Moreover, it also does not matter if your starting point is less than or greater than your ending point. Still, it plots both points. Requirements Microsoft Excel […]

Unit circle trigonometry chart for Excel

Unit circle trigonometry chart for Excel If you ever thought about creating Pac-man or rotating an object in orbit, then the unit circle is a great place to start. Requirements Microsoft Excel 2007 or higher or compatible. Download Chart library  Excel Effects home Charts As you may know, charts help you show data and information […]